Tory Landslide,
Progressives Split
A Datapraxis Analysis of the
UK General Election
Contents
Introduction
3
Analysing the Battlegrounds
7
The regions and nations: what happened where
7
Swings and Roundabouts
9
Bellwether Seats
10
Bolsover
10
Bassetlaw
11
Hendon
12
Finchley and Golders Green
13
Rhondda
14
Sedgefield
15
Stroud
16
Dynamics Behind the Landslide
17
Voter Tribe Analysis: how the British electorate has fragmented
17
How did the Conservative landslide happen?
21
Groups who decided the 2019 election: switchers,
undecideds and the cross-pressured
23
Labour Leave voters
23
Conservative Remainers
24
2017 Labour voters who switched to Remain parties
25
Tactical voting helps, but it is not enough
25
Where could tactical voting have made the most difference?
27
The Undecideds Election?
28
Turnout & voter registration
28
“Get Brexit Done” and Other Campaign Messages
30
Background Notes
32
About Us
Methodology
2
1
Introduction
This election was decisively lost by Labour. Progressives were painfully divided;
all the centre and left-wing parties in England and Wales performed badly, and
Remain campaigners failed to achieve their goals. The Liberal Democrats began
the campaign with immense aspirations, but ended it with one seat fewer. Their
leader, Jo Swinson, even lost her own seat to the Scottish National Party, which
surged to 48 seats, and will push hard for a second independence referendum.
There was no real groundswell of support for Boris Johnson and his Conservative
party. They improved their share of the vote by less than 2% overall, losing over
a million Remainers but gaining more Leave voters. The decisive factor was their
success in winning over voters from the Brexit Party, who decided to stand down
in all seats held by the Tories.
A few hundred thousand more of these voters seem to have switched on polling
day to vote tactically for the Conservatives, helping carry them over the line in a
greater number of tight marginals. This late tactical switch by Brexit Party
supporters is, in our view, the main reason why all the MRP models using the
multi-level regression and post-stratification approach under-estimated the scale
of the Conservative majority.
The Datapraxis MRP model published in the final week was marginally the most
accurate of all the MRPs published in the final week before polling day. It was
94.5% accurate and only mispredicted 35 seats; it was therefore arguably more
accurate than the exit poll, which was 93% accurate and got 44 seats wrong,
despite having fresh election-day data to work with. We worked closely with our
partners at YouGov, using over half a million responses from people giving their
views and feelings about the election, the parties, the campaigns and the leaders.
This was used to give us, and our clients, deeper insight into how people were
going to cast their votes.
YouGov’s final published MRP, released two days before the election, factored in
a Labour surge in the last week and a lower number of seats for the
Conservatives. However, YouGov’s private analysis on the day before the
election, released after polls closed by Professor Ben Lauderdale, picked up a
swing back to the Conservatives, and was significantly closer to the final result.
Labour under Jeremy Corbyn lost nearly 8% of their vote share from 2017,
resulting in the lowest number of seats the party has won in over 80 years (since
1935). Three factors combined to make these results a nightmare for Labour:
1.
Around a quarter of its Leave-supporting voters in the old heartlands -
the so-called “Red Wall” - transferred their vote to the Conservatives;
we estimate the number at 700,000-800,000 voters, based on hundreds of
thousands of polling responses and the YouGov public MRP. Hundreds of
thousands more may have stayed at home, although we need to wait for
more definitive evidence on this point.
3
2.
But crucially, a larger number of Labour’s 2017 voters seem to have
switched to other Remain parties. We estimate that over 1.1 million
Remainers who voted for Labour in 2017 switched to the Liberal Democrats,
the Greens or the SNP in 2019. Importantly, 200-250,000 of the 2017 Labour
Leavers also seem to have switched to these parties, whether because of
“Bregret” or concerns about the Labour leadership or manifesto.
3.
All of these switcher groups had very negative opinions of Jeremy Corbyn.
Both Datapraxis research and other studies find that this is the most
significant factor in Labour’s decline; an Opinium post-election poll found
that lack of trust in Corbyn’s leadership was the main factor, followed a long
way behind by the Brexit balancing act and questions about the party’s
economic policies. The circa 300,000 Remainers who voted Labour in 2017
but switched to the Conservatives illustrate this vividly; our voter tribe
analysis suggests that these people are first and foremost Corbyn skeptics.
In our private polling, Datapraxis asked tens of thousands of people to say in
their own words what their thoughts were about the parties, their leaders and
campaigns. Boris Johnson and the Conservative party were described over and
over again by voters up and down the country using five words: “best of a bad
bunch.” This was true across all ages and loyalties, male and female, young and
old, Leavers and Remainers.
“I was a Labour voter, as was my parents and their parents before, but while
Jeremy Corbyn is leader of the Labour party I will not vote Labour, he has
betrayed the people who were mostly Labour who voted to leave Europe.”
74 year old woman from Darlington in the North East (voting Conservative;
voted Labour in 2015, Labour in 2017 and Brexit Party in the European elections)
“Corbyn is tone-deaf to what he must do. I’ve lost respect for him and how
he weasels out of making any commitment. He needs to ...take a firm LEAVE
or REMAIN position on Brexit. I’ve lost all faith in him and he will be the
reason I do not vote Labour.”
57 year old man from Vauxhall in London (voting Liberal Democrat; voted Remain,
and voted Labour in 2017)
“Boris is an arrogant self-serving individual. Sadly, though, his party has
the best economic record and will do better than Labour at taking the
country forward.”
45 year old woman from Bury St Edmunds in Suffolk (voting Conservative,
voted Remain in 2016)
4
Tactical voting and campaigning played a bigger role than ever before in this election.
But tactical voting by Brexit supporters, the “unilateral pact” through which the Brexit
Party stood down in every seat held by the Conservatives, and the “astroturf” (fake
grassroots) Facebook campaigns which flanked and reinforced the official
Conservative effort, were much more successful than equivalent efforts by
progressives.
The Tories’ majority of 80 seats could have been reduced by 16 if Labour had
properly defended eight of the tighter Red Wall marginals from the beginning, and
by a further 20 or so if progressive tactical voting had been more efficient. Closing
the remaining gap would have required the correction of more fundamental
strategic flaws on the progressive side. But this instant report has no space for a
full lessons learnt analysis; that will come later.
Independent campaigns by Momentum, Hope Not Hate, the Real Change Lab and
Best For Britain could call on decent resources. Some of the most strategic
progressive outrider campaigns were impactful but underfunded. The unions
punched well below their weight, hamstrung by the failure of Labour headquarters
to share its strategic analysis or data. The “Unite To Remain” electoral pact
between the Liberal Democrats, the Greens and Plaid Cymru, set up by
ex-Conservative Remainer Heidi Allen and run by Peter Dunphy, former Treasurer
of the Liberal Democrats, failed completely, and in some marginals - such as
Stroud and Kensington - ended up contributing to the loss of Labour Remain MPs.
According to our analysis in this report, around 78% of voters for the second and
third-placed progressive parties in each seat would have had to vote tactically
instead to block a Conservative majority. This bar is so high as to be unrealistic.
British progressives need to look long and hard at the consequences of their
divisions and bickering over the last decade. A dose of realism is required. It may
be time to think the unthinkable: either the centre and the left can somehow be
reunited under a single banner, or better cooperation and alignment is required
among a diverse flotilla of progressive parties and movements.
One bright point is that 220 women have been elected to the House of Commons:
for the first time ever, more than a third of MPs are women, including a majority of
the Labour and Liberal Democrat contingents (and the only Green, Caroline
Lucas). The new Parliament is also the most ethnically diverse ever.
The Conservatives’ landslide victory will hold for five years. But it is fragile. The
2024 general election could see a dramatic reversal in fortunes. Neither a hard
Brexit nor a long transition period is likely to be good for the country. Boris
Johnson and his allies may come to regret the games they have played between
2016 and now. The voter coalition assembled by Dominic Cummings’s Get Brexit
Done message is temporary and fragile.
5
Britain will be out of the EU by February 2020. The focus of the national
conversation could then turn to the more fundamental challenges dividing our
society and undermining our economy and global environment. Many of the voters
who backed the Tories this year are left-wing on economics, and will end up
disappointed by Cummings’s corporatist turbo-capitalism.
The festering sores of Brexit and immigration which divided these older, heartland
working-class voters from younger, urban and socially liberal progressives will be
settled soon. But there remains a grave risk that the UK will become ever more
deeply riven by the culture wars we see spreading globally, from the US to Austria,
from Israel to India and from Brazil to Poland. Everywhere we look, progressives
are splitting and conservatives uniting. The lessons should be clear. Divided we
fall. But politics is more volatile than ever. Time to shoot the rapids together.
Party
Seats won in 2017
Seats won in 2019
Conservatives
317
365
Labour
262
202
Liberal Democrats
12
11
Scottish National Party
35
48
Plaid Cymru
4
4
Green Party
1
1
Speaker
1
1
Northern Irish parties
18
18
6
2
Analysing the Battlegrounds
The regions and nations: what happened where
This election marked a watershed for Labour. Many of its historic base, traditional
older working-class voters in the Midlands, the North, Wales and coastal towns,
simply could not bring themselves to vote for it. According to Datapraxis estimates,
based on the final YouGov private MRP on 11 December 2019, 900,000 to 1 million
of Labour’s 2017 Leave voters will have ended up backing Boris Johnson or the
Brexit Party.
But a larger number of Labour’s voters - over 1.3 million according to our numbers
- switched to other Remain parties. Importantly, many Labour switchers to other
Remain parties live in majority Leave seats. This group include 200,000-250,000
who voted Leave in 2016; and Labour’s 2017 voter coalition in those places was
often fairly evenly split between Remainers and Leavers. The “ecological fallacy”
has led less thoughtful commentators to assume that all 2017 Labour voters in
majority Leave seats voted for Brexit. But this was absolutely not the case, even if
much of the Conservative and Brexit Party support in these seats comes from older,
formerly-Labour voters who left the party between 2005 and 2017.
Our private polling moved during the campaign, but it showed Labour retaining
sometimes as few as 50% and never as many as two-thirds of people who voted
for Labour in 2017 and Leave in 2016. The final YouGov number was 60% staying
with Labour, 24% going to the Conservatives, just 6% to the Brexit Party and 8% to
other Remain parties. With turnout down across many of these heartlands and
many of these voters remaining undecided until polling day, our research and
analysis suggests that post-election surveys may show that hundreds of thousands
of this group simply stayed home.
The YouGov public model also predicted that 5% of the electorate this time would
be composed of people who voted Leave in 2016 but stayed at home in the 2017
elections. This group of almost 3 million people, many of them former UKIP voters
and some people who typically do not vote in general elections, arguably played a
much more significant role in the Conservatives’ success than any shift amongst
Labour Leavers. These disillusioned ultra-Brexiteers were probably the main target
of Dominic Cummings’s “Get Brexit Done” message.
The Conservatives’ vote went up less than 2% overall; importantly, they also lost over
a million of their 2017 voters who had supported Remain according to our numbers.
Around 7 in 10 defecting Tory Remainers went to the Liberal Democrats, but over
250,000 of them switched directly to Labour and a smaller number to the Greens.
In any case, Labour lost votes in every region and nation of Great Britain. It lost
over 13% of its 2017 voter total in the North East, and over 11% in Yorkshire and
The Humber. It lost over 8% of its voters in the Midlands, Wales, Scotland, and in
the North-West and East of England. Its losses were lower, but still substantial in
London and the South.
7
The chart below shows how the share of the parties’ vote in each region changed
between 2017 and 2019:
Change in Vote Share since from 2017 - 2019
Region
Conservative
Labour
Liberal Democrat
East
2.79%
- 8.57%
5.72%
East Midlands
4.83%
- 9.65%
3.62%
London
- 1.59%
- 6.32%
6.52%
North East
4.23%
- 13.1%
2.28%
North West
1.57%
- 8.67%
2.65%
South East
0.26%
- 6.83%
7.87%
Wales
3.37%
- 8.18%
1.51%
West Midlands
5.11%
- 9.56%
3.72%
Yorkshire and the Huber
3.77%
- 11.21%
3.33%
Scotland
- 2.52%
- 8.78%
2.54%
Northern Ireland
0.17%
0%
0%
The Conservatives increased their vote share in every region except London and
Scotland. But these increases were comparatively modest, peaking at just over 5%
in the West Midlands. In the East Midlands and the North East they scored rises of
over 4%; but everywhere else the increase was smaller, particularly in the South
and the North-West.
The Liberal Democrats increased their share of the vote in every region in the
country, even in Scotland, despite the loss of Jo Swinson’s seat. Our research
suggests that much of their surge came at Labour’s expense. The Liberal
Democrats’ largest increase, nearly 8%, came in the South East. In London they
gained over 6%; but while they are now placed second in many more seats, their
overall total of seats fell.
Datapraxis compared the seats Labour lost this time to the constituencies where it
was wiped out in the 1983 election - the last time the party performed anywhere
near this badly. In 1983 Labour held 17 of its Red Wall seats, but suffered greater
losses in Eastern England and the South East.
Today, Labour’s Red Wall stands no more. Many of the great heartlands of
Lancashire, Yorkshire, Nottingham and the North have fallen to the Conservatives.
Only 5 of the 32 most vulnerable seats in the Red Wall that we identified in the
Datapraxis mid-campaign report, 65 Battleground Seats For Labour, are still held
by the party after this election. Many of the seats lost were not even on the
defensive targets list initially.
8
Labour lost seats like Darlington and Bishop Auckland in County Durham,
Dewsbury and Wakefield in West Yorkshire, Dennis Skinner’s Bolsover seat in
Nottinghamshire, Warrington South and Hyndburn in Lancashire. Other seats to
go were Sedgefield in County Durham, once a safe seat for Tony Blair; Redcar,
which Mo Mowlam held; and Blyth Valley in Northumberland.
Even more significantly, Labour lost eight of the 13 seats we identified as easier to
defend in that report, many of them by tiny margins. It lost Bolton North East by
378 votes, having sent activists instead to campaign in the unwinnable Bolton West.
Bury North was lost by 105 votes, High Peak by 590, Gedling by 679 and Delyn
by 865. A properly targeted and run campaign could have retained all these seats.
Meanwhile, the Liberal Democrats, who began the campaign almost neck and neck
with Labour with a claim that Jo Swinson could become prime minister and cancel
Brexit, ended up with one seat fewer. Swinson lost her own seat of East
Dunbartonshire, and her Brexit spokesman Tom Brake lost Carshalton &
Wallington. Only three of their long list of target marginals were won: St Albans,
Richmond Park, and North East Fife.
Swings and Roundabouts
The biggest swings from Labour to Conservative in this election were in Leicester
East, Bassetlaw, Redcar, Rhondda, Mansfield, Dudley North. Not all of these
seats changed hands. In both Dudley and Leicester East there were particular
local circumstances; the other seats were once places were Labour votes were
weighed rather than counted.
Compare this to seats with the biggest loss of votes for Labour in 1983:
Horsham, Wokingham, New Forest, Buckingham, Winchester, Yeovil,
Portsmouth North - all seats in the South or South West.
12 seats changed hands in the North West, 9 each in the West Midlands and
Yorkshire & The Humber, 7 in the North East, and 6 in Wales. Every one of these
seats went from Labour to Conservative.
This election saw the political realignment catalysed by the Brexit referendum
continue. The top 20 majority Leave seats in the 2016 Referendum are now in
Conservative hands. In the 2015 election, Labour held 5 of these. Mansfield and
Walsall North changed hands in the 2017 election; this time they were followed
by Don Valley, Rother Valley and Stoke-on-Trent North.
The seats that registered the highest Remain votes in 2016 have had a different
trajectory. 13 of these were in London; they include Jeremy Corbyn’s own seat of
Islington North. 12 of them were already held by Labour. The 13th, Putney,
became the only new seat won by Labour in this election, despite two-thirds of its
initial priority seats list having been “offensive” seats it hoped to pick up off its
opponents. A further six of the most Remain seats were in Scotland. All, including
Swinson’s East Dunbartonshire, are now held by the SNP.
9
Bellwether Seats
Constituency: BOLSOVER
The Labour party had held this seat since it was created in 1950. Dennis Skinner,
who embraced his nickname as ‘The Beast of Bolsover’, had been its Labour MP
for 49 years. He was a leading light of the left-wing Campaign Group and a
notorious fixture on the benches in the House of Commons. He lost by over five
thousand votes, losing 16% of Labour’s vote share compared to 2017. The
Conservatives saw a 7% increase and the Brexit Party a 9% increase.
“Do you want polite? Politely I think his
policies (Jeremy Corbyn’s) would put this
country into so much debt we’d take eons
to recover.”
66 year old woman from Bolsover in the East Midlands
(voted Conservative in 2019, Labour in 2015 and 2017,
and Brexit Party in the 2019 European elections)
Mark Fletcher
Dennis Skinner
Votes: 21,791
Votes: 16,492
CON GAIN
2016 Referendum Majority Leave Vote:
68%
Estimated proportion of Labour 2017 voters who also voted Leave:
45%1
Demographics
Once a bastion of the Derbyshire coalfield, this seat suffered its share of
troubles in the 1980s and 90s and still has a relatively high proportion of
people in public housing and higher than average levels of child poverty
compared to national averages.
1
These estimates of the proportion of the Labour 2017 vote who voted Leave in the referendum
come from large sample MRP work conducted by Election Data in 2018. Bolsover is one of the
only seats where slightly more Labour 2017 voters had also voted for Leave rather than
Remain; the remainder of its support came from a mostly-younger group of people who had
not voted in the referendum.
10
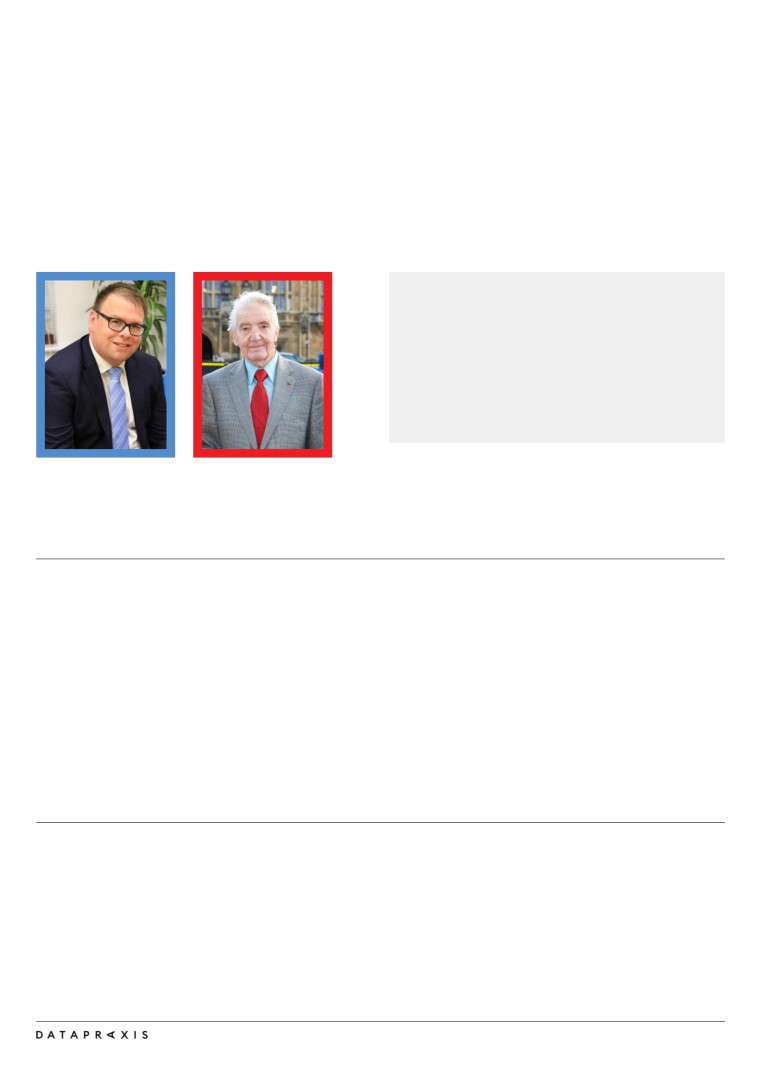
Constituency: BASSETLAW
The Labour party has held this seat since 1929. The last time a Conservative
member was elected here was 1924. It was once a traditional mining area which
Labour would have considered rock solid. The Conservatives saw a 12%
increase in their vote share and Labour lost 25% of its share, after the anti-
Corbyn Labour incumbent John Mann stood down dramatically. Turnout was
down by 3% compared to 2017.
Brendan Clarke Smith
Keir Morrison
Votes: 28,078
Votes: 14,065
CON GAIN
2016 Referendum Majority Leave Vote:
67%
Estimated proportion of Labour 2017 voters who voted Leave:
45%
Demographics
An older age profile, with more than 60% of voters 50+.
11
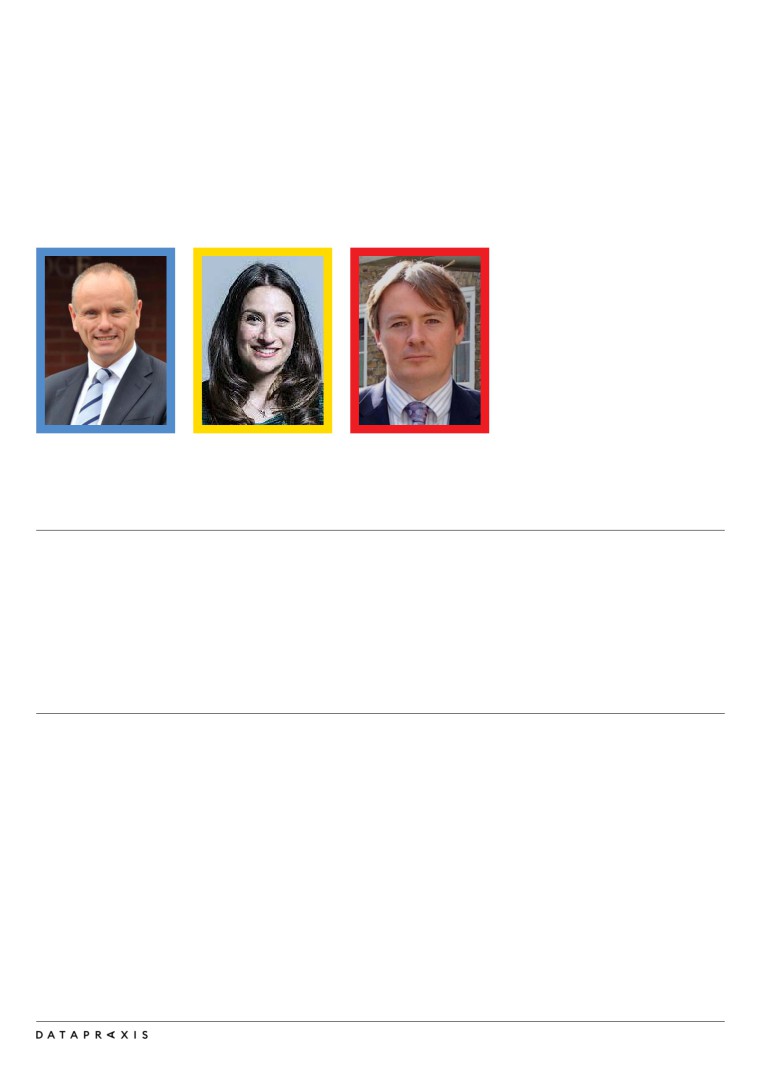
Constituency: HENDON
A traditional Conservative-Labour bellwether seat on the periphery of London.
Hendon had a long history of conservative incumbency until 1997 when it returned
a Labour MP for the first time and was held by Labour until 2010 when the
Conservatives regained the seat.
Pinto-Duschinsky saw his support surge through the campaign, but the final result
in Hendon saw him falling just short, likely due to a combination of Labour’s
challenges with Remainers and Jewish voters, and a lack of tactical voting.
Matthew Offord
David
Clareine Enderby
Portia Vincent-Kirby
Pinto-Duschinsky
Votes: 26,878
Votes: 4,628
Votes: 921
CON HELD
Votes: 22,648
2016 Referendum Majority Remain Vote:
63%
Demographics
An increasingly diverse constituency, including the second largest
Jewish population in the UK and a high number of migrants from both
within and beyond Europe.
12
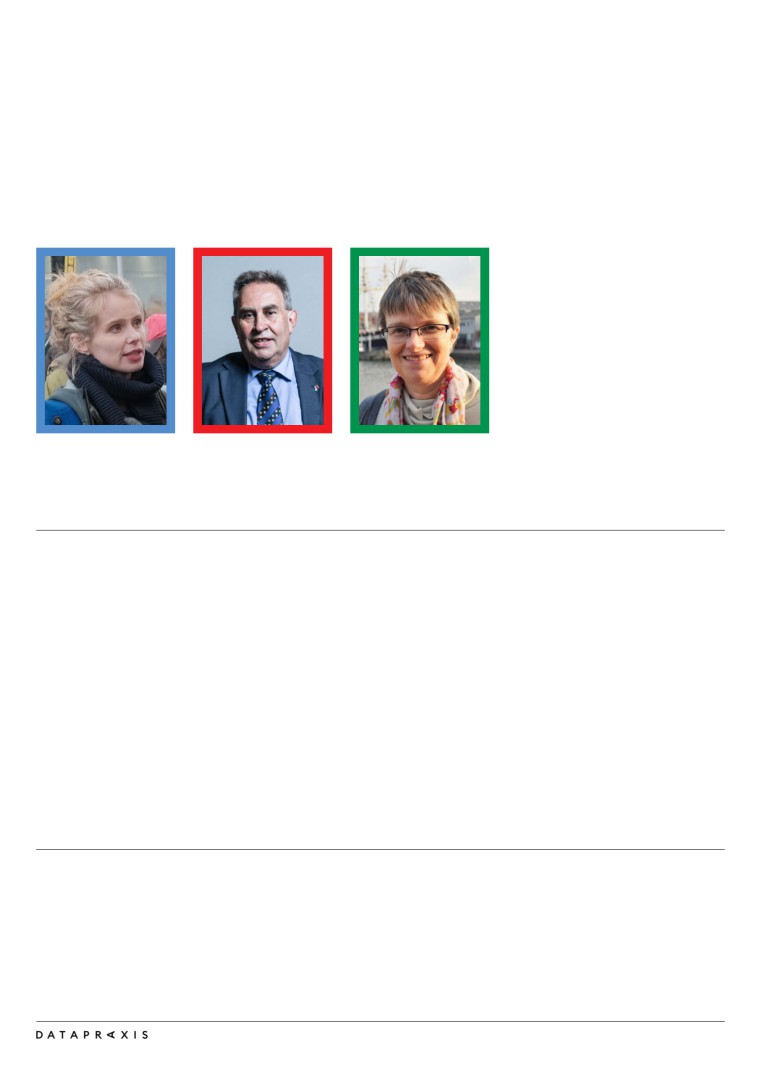
Constituency: FINCHLEY and GOLDERS GREEN
This seat has the largest Jewish population in the country, 28% in the last census.
It was a safe seat for Mrs Thatcher in the 1970s and 1980s, but went Labour in
the 1990s. Luciana Berger, who resigned from the Labour Party over anti-semitism,
stood here for the Liberal Democrats, but failed in the end to unseat the sitting
Conservative MP. Labour lost 20% of its vote share and the Liberal Democrats
added 25%. Even though there was a clear anti-Conservative majority in this seat,
it was completely split, handing victory to the Tories.
Mike Freer
Luciana Berger
Ross Houston
Votes: 24,162
Votes: 17,600
Votes: 13,347
CON HOLD
2016 Referendum Majority Leave Vote:
62%
Demographics
Part of the prosperous outer London ring. 40% of the population have
higher level qualifications, well above the national average, and nearly
40% were born outside the UK.
13
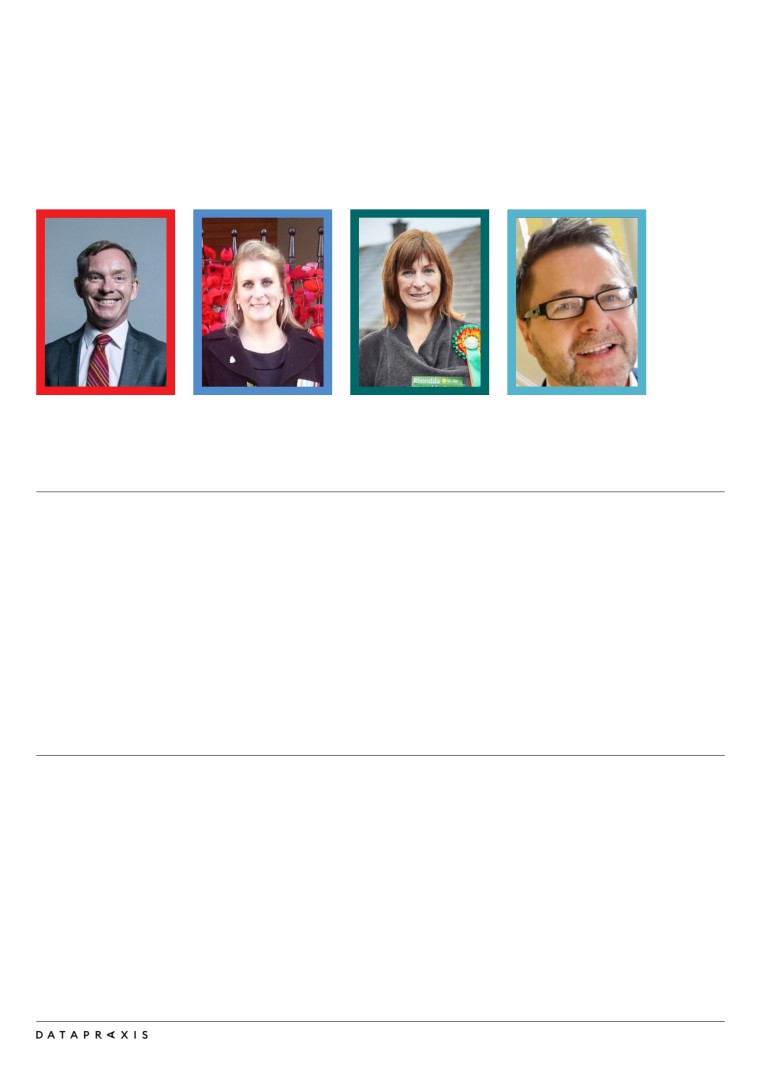
Constituency: RHONDDA
Rhondda is a quintessential Labour seat in the South Wales Valleys. Labour held
on here despite losing nearly 10% of its vote share. This is a seat where they were
helped by the Brexit Party, which split the Brexit vote, taking 12%, while the
Tories added only 6% to their vote share. Many voters also stayed at home this
time; turnout was less than 60%, down over 6% since 2017.
Chris Bryant
Hannah Jarvis
Branwen Cennard
John Watkins
Votes: 16,115
Votes: 4,675
Votes: 4,069
Votes: 3,733
LAB HOLD
2016 Referendum Majority Leave Vote:
55%
Estimated proportion of Labour 2017 voters who voted Leave:
39%
Demographics
Rhondda is one of the most deprived constituencies in the UK. 31% of
its population have no qualifications. People have a lower life expectancy,
and worse health outcomes than the Welsh average. 22% of people
here receive benefits.
14
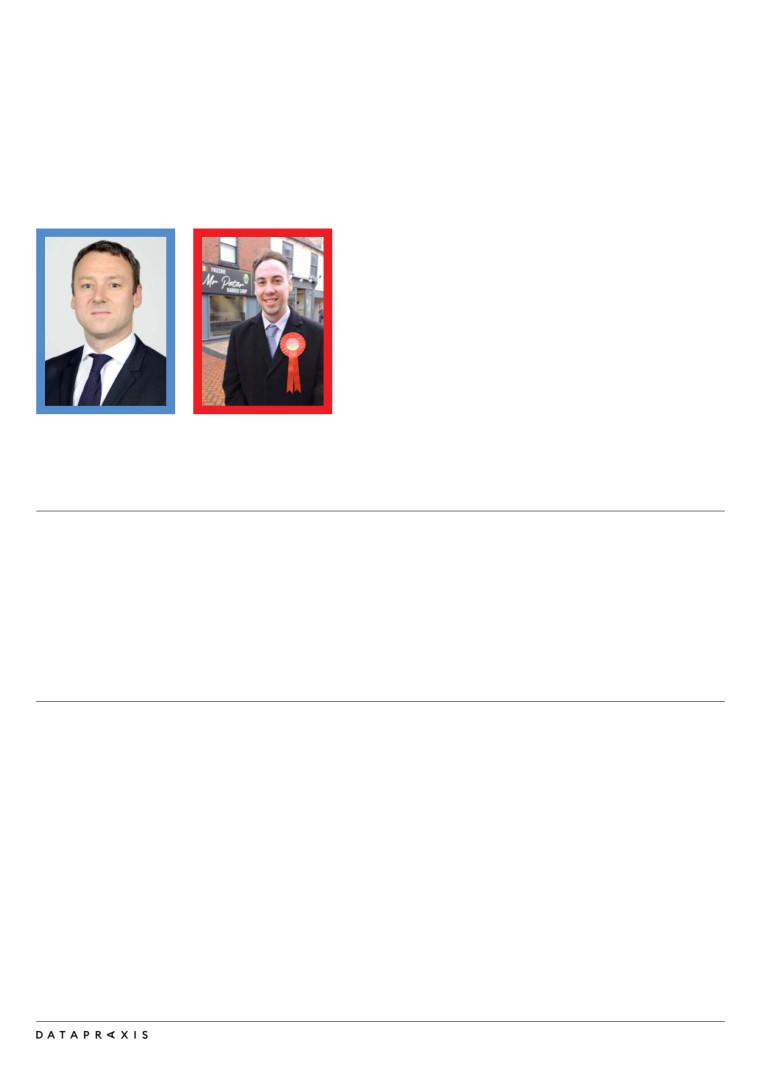
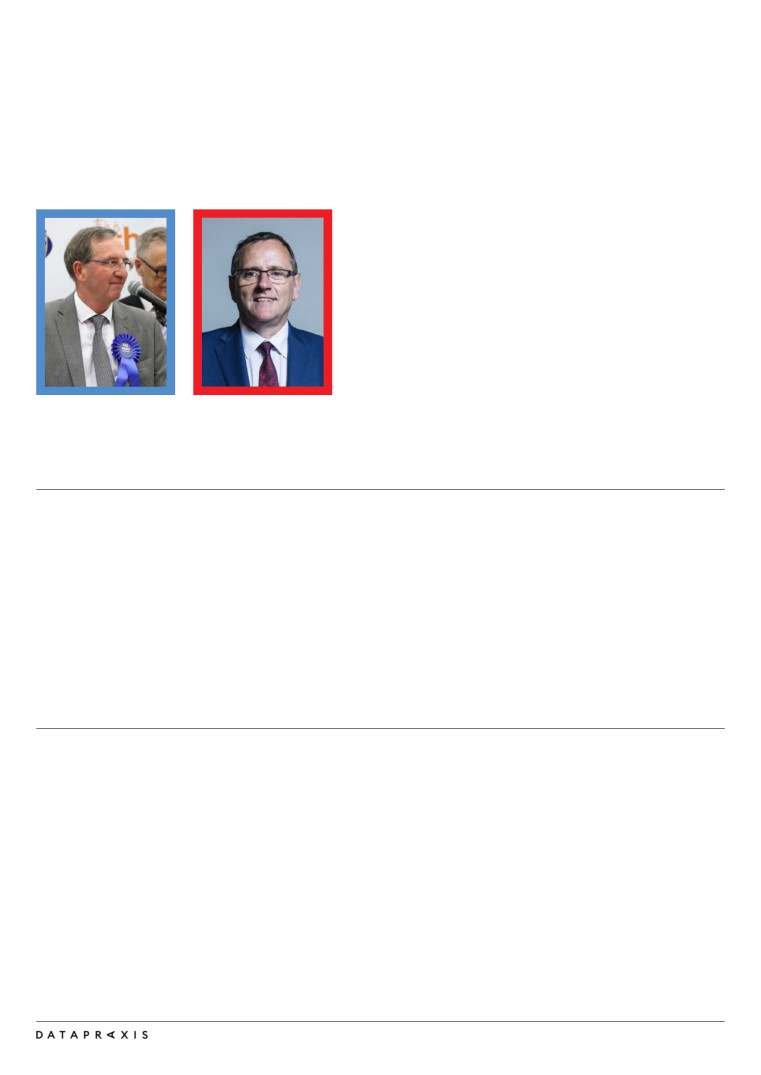
Constituency: SEDGEFIELD
Sedgefield in Durham has been continuously represented by a Labour MP since
1935. Tony Blair held it from 1983 to 2007. In the past, Labour support in parts of
the constituency was nearly monolithic, but no longer: it now has a Conservative
MP. In this election, Labour lost 17% of its vote share. The Conservatives and the
Brexit Party both increased their share of the vote by 8%.
Paul Howell
Phil Wilson
Votes: 19,609
Votes: 15,906
CON GAIN
2016 Referendum Majority Leave Vote:
57%
Estimated proportion of Labour 2017 voters who voted Leave:
33%
Demographics
Over 27% of the population in Sedgefield have no qualifications; 27%
have no car. One of the main local employers is the Hitachi factory, but
this seat also includes some wealthier suburbs of Darlington.
15
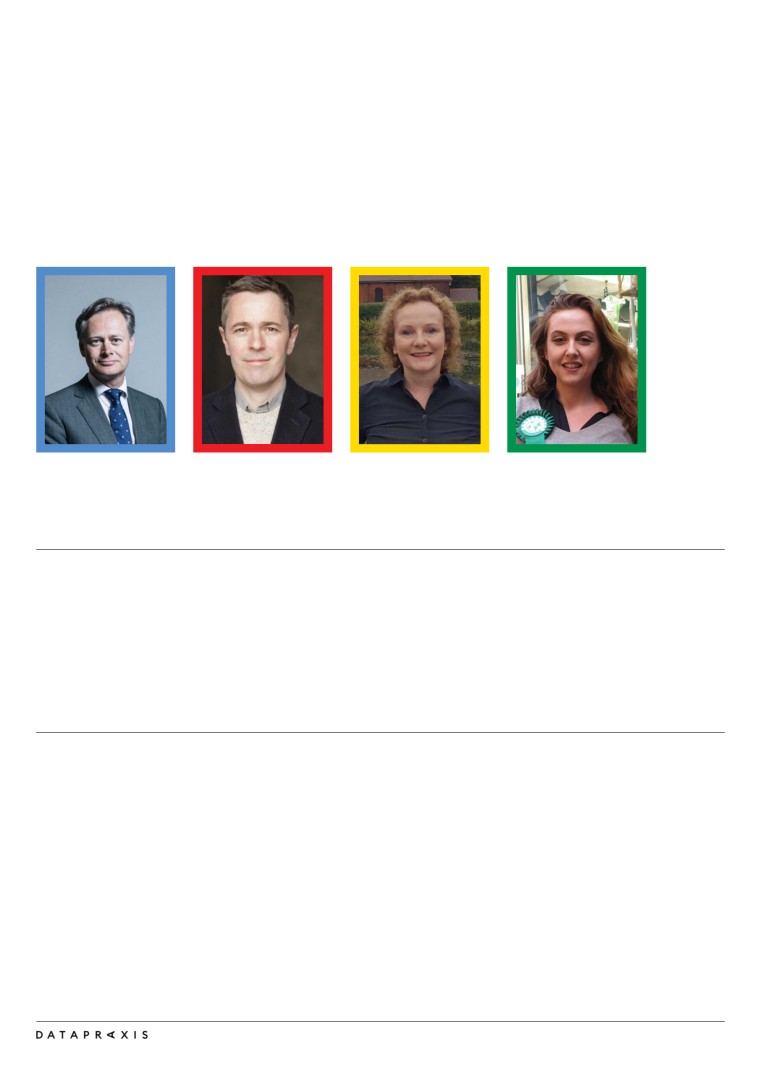
Constituency: STROUD
The Liberal Democrats stood aside here for the Green Party as part of the “Unite
to Remain” electoral pact between these two parties and Plaid Cymru. Labour’s
overall vote share in Stroud dropped by nearly 5%; the Greens’ vote share rose by
just over 5%, and the Tory vote also increased slightly (by 2%). The net result was
the loss of a key Labour-Tory marginal seat, and an increase of 2 in the
Conservative majority. Progressive parties would do well to reflect on the
learnings from this and other similar experiences across the country.
Siobhan Baillie
David Drew
Molly Scott Cato
Votes: 31,582
Votes: 27,742
Votes: 4,954
CON GAIN
2016 Referendum Majority Remain Vote:
55%
Estimated proportion of Labour 2017 voters who voted Remain:
70%
Estimated proportion of Labour 2017 voters who voted Leave:
20%
Demographics
This is a sparsely populated, largely rural Gloucestershire constituency.
It has a highly skilled workforce, reflecting the nature of its high tech
manufacturing and service base. Stroud itself is now becoming a
commuter town for the South East and South West.
16
3
Dynamics Behind the Landslide
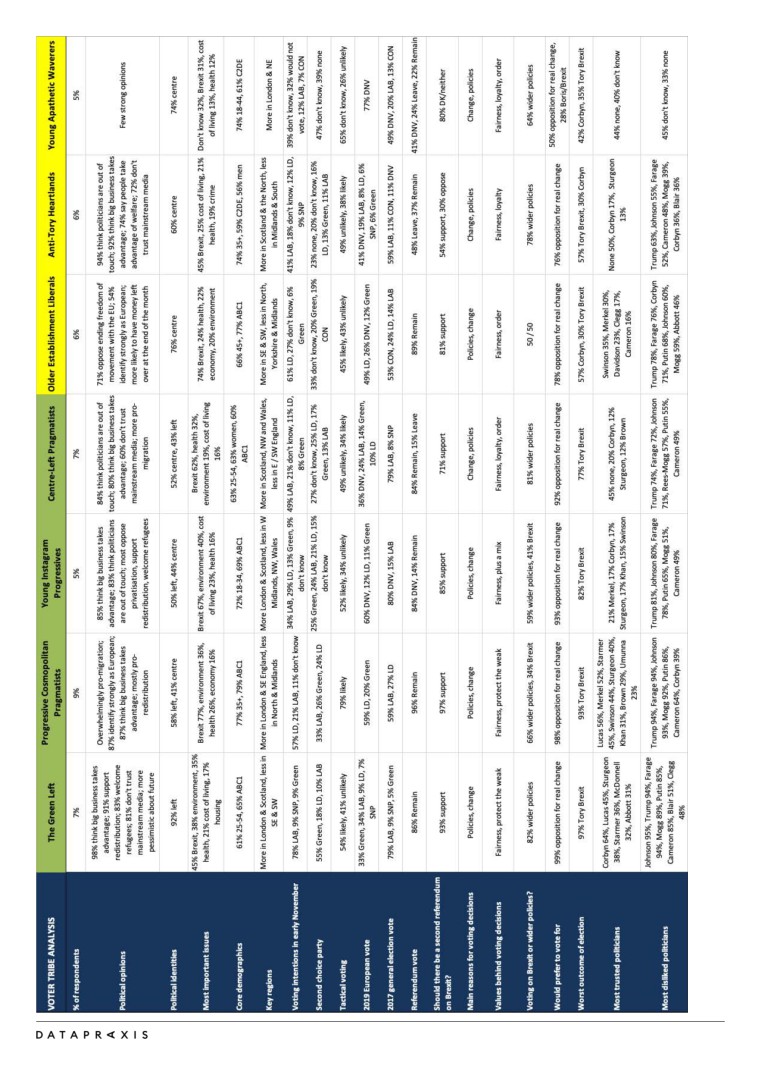
Voter Tribe Analysis: how the British electorate has fragmented
Around the time this election was called, Datapraxis commissioned a 10,000
sample poll from our research partners YouGov, which was fielded between 28th
October and 5th November 2019. We used the responses to build a “voter tribe
analysis” that divides up the electorate into fourteen different groups. A cluster
model assigns respondents to a tribe based on patterns of similarity between their
responses to over 85 questions. This analysis vividly illustrates how worldviews,
value systems and political tendencies differ across the British electorate. This is a
story of multi-dimensional fragmentation; it cannot simply be explained by Remain-
Leave or left-right polarisations.
The first seven tribes we identified lean toward progressive views, and together
make up 45% of the electorate. “The Green Left” is the heart of Jeremy’s Corbyn’s
support base, and “Centre-Left Pragmatists” are the other core Labour-supporting
group. Together with the Green Left, “Progressive Cosmopolitan Pragmatists” and
“Young Instagram Progressives” were the groups most likely to vote tactically
against the Conservatives.
Many “Older Establishment Liberals” voted Conservative under Cameron, and
even in 2017; but they mostly now support the Liberal Democrats. “Anti-Tory
Heartlands” voted more Leave than Remain, but are generally Labour and
supported a People’s Vote. “Young Apathetic Waverers” are less likely to turn out,
and more likely to be swing voters if they do.
“Boris has been shown to repeatedly lie and deceive the public. I have voted
Conservative in every election to this point, but cannot vote this time for
Conservative due to the content of his character. Many people in the country are
struggling and the policies are doing nothing to benefit the poorest in society.”
40 year old man from Bradford East in Yorkshire and The Humber (voting Liberal Democrats in
2019, voted Conservative in 2017 and in the 2019 European Elections, and Remain in 2016)
17
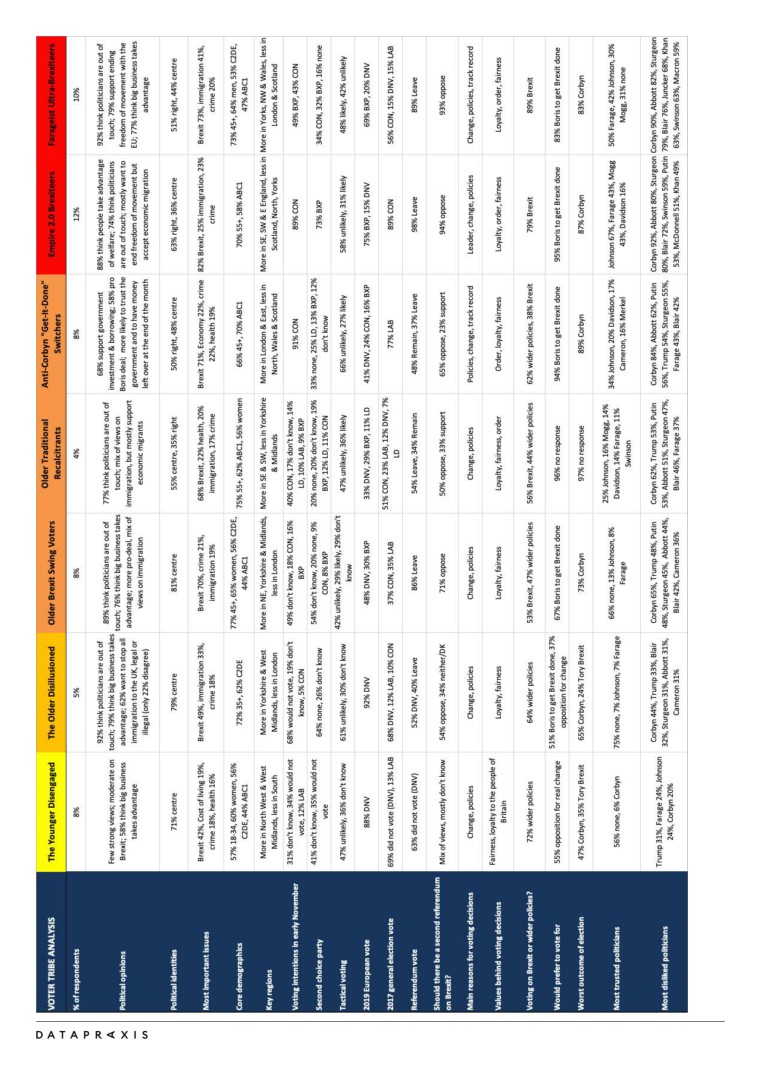
Turning to the remaining 55% of the electorate, five tribes seem to have rallied
heavily behind the right-wing parties in this election. The “Farageist Ultra-
Brexiteers” voted overwhelmingly for the Brexit Party in the European Parliament
elections earlier this year. They started the general election campaign splitting their
votes between Farage’s party and the Conservatives, but most of them ended up
voting tactically for Boris Johnson to ‘get Brexit done’. Meanwhile, “Empire 2.0
Brexiteers” are more typical older Conservative voters, who also voted heavily for
the Brexit Party in the Europeans but have returned to the fold since.
One of the most interesting swing voter tribes are the “Anti-Corbyn Get-It-Done
Switchers”, who voted heavily for Labour in 2017, but overwhelmingly for the
Conservatives in this election. They are fed up of Brexit and want to get it over
with; they intensely dislike the Labour leader. They are more pro-system than most
groups, and also support policies like redistribution. This group likely formed the
core support base for the failed breakaway Independent Group in Parliament,
which later became Change UK; independent ex-LabFour MPs like Ian Austin and
Ivan Lewis also ended up endorsing the Tories in this election.
“I can not bear the thought of Jeremy Corbyn and his stupid ideas running
the country, but Johnson is so bad. For the first time in 59 years I feel afraid
of what will happen to the country and of the dangerous direction it is going
in. There are no real leaders any more no one to be trusted. We need
someone with integrity and honour to lead us, not a cad and a clown.”
59 year woman from Chesterfield in the East Midlands who was planning to vote Conservative,
voted Conservative in 2017 and in the European Elections, voted Remain in the Referendum.
“Older Brexit Swing Voters” split between the Conservatives and Labour in 2017,
then moved more decisively toward the Brexit Party and the Tories. They are an
older, more female tribe, who lean to the left on economics but to the right on
social issues. It seems likely that they turned out heavily for Boris Johnson this
time. “Older Traditional Recalcitrants” are more reticent to give strong views, but
typically lean strongly Conservative. Majorities of both these tribes also dislike the
Labour leader.
“Crazy, cannot afford their proposals, don’t like their team especially Corbyn, do
not respect them for not honouring the Brexit vote which they said they would,
not trustworthy.”
66 year old man from Vale of Clwyd in Wales (voting Conservative; voted Labour in 2015,
Labour in 2017 and Brexit Party in the European elections)
20
“The Older Disillusioned” are a group who typically have not voted recently,
although 2 in 5 of them voted Leave; they are intensely anti-immigration. “The
Younger Disengaged” usually do not turn out and have few strong views -
although they leaned toward supporting opposition parties over Johnson at the
start of the campaign, and a few of them turned out for Labour in 2017.
This voter tribe analysis conducted by Datapraxis at the beginning of the election
campaign helps shed new light on its outcome. In the 20 or so seats the Brexit
Party contested seriously, the Farageists and the Empire Brexiteers split the right-
wing vote, helping Labour to win even on a diminished share. But elsewhere most
hardline Brexit supporters, most of the right and some centre or swing voters all
fell in behind Boris Johnson’s Conservatives, especially after the last-minute Brexit
Party collapse from 2.9% to 2.1%. Remain and progressive voters were much more
widely scattered among Labour, the Liberal Democrats, the Scottish and Welsh
nationalists and the Greens.
Any party or leader seeking to assemble a winning voter coalition in future must
understand the differences (and similarities) of worldview and values amongst
these fourteen tribes. In particular, it is important to understand the lived
experience and worldviews of working-class voters in towns and rural communities
in the former Labour heartlands. Millions of these people voted Remain, as well as
the millions who voted Leave; hundreds of thousands did not vote at all in the
referendum. Taken together, these are the voters most likely to decide the outcome
of the 2024 general election. The battlefield is now very different from what it was
when John Major, Tony Blair, Gordon Brown, Nick Clegg and David Cameron were
vying with each other for the support of the aspirational middle-class, although
that group is now the one more likely to be voting tactically in the South.
How did the Conservative landslide happen?
Labour’s seismic losses to the Conservatives across its traditional heartlands have
been a long time coming. While every community is different, multiple factors have
combined in a perfect storm. They include decades of economic stagnation and
increasingly precarious work; austerity, cuts to local government and the retreat of
the social safety net; the decline of the high street with the rise of offshore internet
commerce platforms; and the departure of children and grandchildren to study and
work elsewhere.
These factors have intersected with an increasingly intense skepticism about a
system many believed to be rigged against them, strong anti-immigration feelings,
a sense that politicians are out of touch, and a belief that social security and public
21
services are being exploited by others. The relentless drumbeat of sensational and
misleading tabloid news stories has been taken to a new level, with the rise of
social media as a vector for disintermediated communications in which “filter
bubble” effects can lead to fake news and sentiment spreading like wildfire.
All these dynamics have been decades in the making. But Brexit crystallised them.
It provided an imaginary path to national renewal and “taking back control”,
splitting these voters off from the Labour Party and bringing them closer to the
Conservatives or the Brexit Party.
These shifts have taken place against a broader backdrop of a generalised decline
of party loyalties. Decades ago the class-party alignment was much clearer,
although there has always been a significant Conservative working-class vote,
including in Thatcher’s time. But in the last two decades, social trends and political
and economic dislocations have led to increasing churn; record numbers have
switched to vote for a different party in the three elections since 2015.
Five years ago, the Scottish independence referendum shook the kaleidoscope in
that former Labour heartland, opening the way for the Scottish National Party to
replace Scottish Labour as a hegemonic force. This development has made it a
great deal harder for Labour to win an overall majority in Westminster, and that
does not look likely to change soon. While it recovered briefly in Scotland in 2017,
it fell back again in this election. There is a real risk that a similarly lasting
de-alignment could now take hold in the traditional heartlands won by the
Conservatives in the Midlands and parts of the North.
Trust in politicians also seems to be declining slowly; the combined net approval
ratings for the two candidates to be Prime Minister at the beginning of this election
were lower than in any previous election. In thirteen of our fourteen voter tribes, large
majorities agree with the statement that “Politicians are out of touch with the interests
of people like me” (the exception is the Young Apathetic Waverers, who say they don’t
know). There is only one tribe where a majority agrees that “I can trust the government
of the UK to look after my interests” - the Anti-Corbyn Get-It-Done Switchers.
Our research across Europe has found related patterns of system-skepticism and
fragmentation in most countries, although they vary by degree and in specifics.
The state of public opinion in France, Italy and Eastern Europe is particularly
volatile at present.
In proportional electoral systems we see a trend toward political fragmentation and
coalition government. But in the UK, the first past the post system still
disproportionately favours whichever party is best able to concentrate a large
22
minority bloc behind it. This has mostly been the Conservatives in recent decades,
with the exception of the 1997-2010 period.
In the 2019 general election, the Liberal Democrats spent much of their time
attacking Labour rather than the Conservatives. Animosities reign between Labour
and the Lib Dems over many issues, in particular Brexit, the austerity record of the
2010-2015 coalition government, and who is best-placed to win each seat. In
short, fragmentation is hurting progressives and helping conservatives win.
Groups who decided the 2019 election:
switchers, undecideds and the cross-pressured
Labour Leave voters
In this election, almost one in four Labour Leave voters crossed the rubicon and
voted Tory for the first time, according to private MRP research now published by
our partners at YouGov, which was based in private polling also licensed to
Datapraxis2. Depending on turnout, we estimate that Labour Leave to Tory
switchers were between 700,000 and 800,000 voters. Labour in the end retained
only 60% of its 2017 Labour Leave vote; earlier in the campaign, it was doing even
worse among this group.
Nigel Farage made a great noise about targeting Labour Leave voters in the
heartlands. But in the end, the Brexit Party was winning at most 6% of this group
according to the MRP. Remarkably, Lauderdale and Blumenau estimate that a
larger number - fully 8% of the 2017 Labour Leavers, more than 200,000 people -
switched instead to Remain parties (the Liberal Democrats, the Greens or the
SNP). According to our review of open-ended polling responses, the key drivers of
this shift are likely to be either that they have changed their mind about Brexit, or
that they do not like Labour’s current leadership.
Brexit is best seen as a symptom, not a cause, and certainly not the only cause of
Labour’s loss of its Leave voters. This move was decades in the making, and there
was no single factor. The widespread media attacks on Jeremy Corbyn over his
alleged unpatriotism, anti-semitism, pacifism and radical left views resonated
powerfully in many of these communities. Most of these voters are also older; the
Tories won the overwhelming majority of over 65s in this election.
2
“MRP Methodology, Tables and Figures”, Ben Lauderdale & Jack Blumenau (YouGov), 11
23
“Untrustworthy. Sold his long-held political beliefs to stay party leader. I was
a Labour member, since Labour’s stance and betrayal of democracy I’m not.
I’ve also cancelled my union membership.”
60 year old man from Wolverhampton in North East, West Midlands (voting Conservative; voted
Leave in 2016, Labour in 2017 and Brexit Party in the European elections)
Datapraxis’s partners at Election Data have created a classification of five types of
Labour Leave voters: blue-collar working households, legacy older council estate,
those struggling to make ends meet, the totally disaffected, and a younger group
termed transient terraces.
Taken collectively, 52% of Labour Leave voters disliked Jeremy Corbyn according
to our massive-sample polling. A similar proportion - 48% - disliked Boris
Johnson. They were evenly split on whether a Tory Brexit or a Corbyn led
government was the more serious danger to the country.
Interestingly, 54% of Labour Leave voters listed the NHS in their top two issues,
compared to only 37% for whom Brexit was in their top two issues.
Conservative Remainers
These voters are mostly well-educated and in secure, well-paid employment. A
common thread for Conservative Remain voters is that they have agency over their
lives. They have traditionally prioritised economic stability and prudence and
“small-c” Conservatism and are turned off by the divisive rhetoric of the right of the
Conservative party.
Our partners at Election Data have created a classification of five types of
Conservative remain voter. These include older, successful voters in sought after
areas, older voters in commuter belts and outer suburbs; middle income families;
young families in new housing, and couples or singles in their first home.
Unsurprisingly, 88% of this group dislike Jeremy Corbyn; 33% like Boris Johnson.
66% stated that the most serious danger to the country would be a Corbyn-led
government, compared to only 10% saying they were more worried about a
Tory Brexit.
“Boris is an arrogant self serving individual. Sadly, though, his party has
the best economic record and will do better than Labour at taking the
Country forward”
45 year old woman from Bury St Edmunds in the East of England (voting Conservative, voted
remain in 2016 and did not vote in the European elections in 2019)
24
2017 Labour voters who switched to Remain parties
As noted above, we estimate that over 200,000 2017 Labour Leave voters switched
to the Liberal Democrats, the Greens or the SNP. They can be added to over 1.1
million 2017 Labour Remain voters who switched to Remain parties (mostly the
Liberal Democrats), according to Datapraxis’s estimates based in the published
YouGov MRP numbers from 11 December 2019.
In total, we therefore estimate that over 1.3 million of Labour’s 2017 voters
switched to other Remain parties, while something like 700,000 to 800,000 of its
Leave voters and 300,000 of its Remain voters switched to the Conservatives (the
latter group most likely because of their views on the leadership).
This was despite the policy of supporting a second referendum to give the people
the final say on Brexit, which the Labour leadership arrived at late and reluctantly.
Without that shift, we can confidently say that Labour would have lost many more
of its majority of Remain voters in this general election; it might even have fallen
well behind the Liberal Democrats going into this election, and have been wiped
out much more badly. The previous policy of delivering a “Red Brexit” was even
less viable than the Final Say position.
Switchers from Labour to other Remain parties are generally prosperous.
Compared to labour voters, climate change weighs heavily on their mind; 30%
listed it as one of their top two most important issues.
Similarly to the Labour Leave voters, 52% of this group dislike Jeremy Corbyn.
They were deeply opposed to Brexit; only 1% agreed that we should “Get Brexit
Done, unleash Britain’s potential.” It is important to note, however, that only 5% of
this group believed that a Corbyn led government posed the greatest danger to the
country, compared to the 69% who believed that a Tory Brexit was the greater
threat. This is perhaps ironic. In some seats, if they had stuck with Labour, they
might have made the difference.
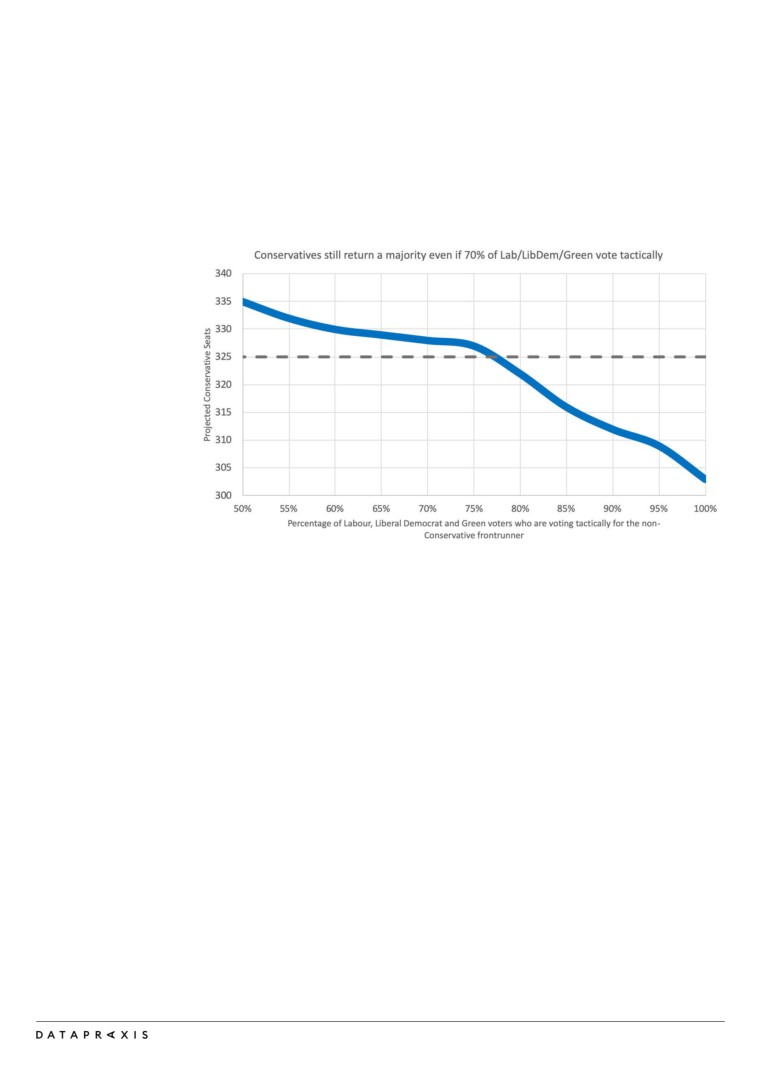
Tactical voting helps, but it is not enough
Datapraxis ran a model on the election results to see what would have happened
with various levels of tactical voting by Labour, Liberal Democrat and Green voters
in England and Wales. We found that even in the unrealistic scenario where all of
these people voted as a block for the frontrunner party best placed to challenge
Conservatives in each seat (for example, if all Liberal Democrats and Greens had
voted Labour in places like Kensington, and all Labour or Green supporters had
voted Liberal Democrat in places like Esher and Walton), this would only just avoid
a majority Conservative government.
25
The results would then have been as follows: 303 seats for the Conservatives, 241
seats for Labour, 28 seats for the Liberal Democrats, 52 seats for the SNP, 4 for
Plaid Cymru, 1 for the Greens, 3 seats for others and 18 Northern Irish seats.
Only a full “progressive alliance” or electoral pact in which parties agreed to stand
down for each other could have delivered this outcome, and even then it might have
been in jeopardy if some of the supposed tactical voters abstained. If the smaller
parties in each seat are on the ballot, they will inevitably attract some votes. We
found that around 78% of voters for non-frontrunner progressive parties in each
seat would have had to vote tactically to block a Conservative majority this time.
Tactical voting and “squeeze” dynamics in which voters opt for the party best
placed to stop the party they like least clearly played a significant role in the final
outcome. According to reports from the main tactical voting websites, perhaps 20%
of voters checked a tactical voting website, and they are likely to have been
disproportionately concentrated in 100-150 key marginal seats.
In 2019, the five seats in which Labour suffered its highest loss of vote share were
as follows:
— In Southern England, Esher and Walton (where it lost 77% of its 2017 vote),
Mole Valley (down 63%), and St Albans (down 62%) - all losing mostly to the
Liberal Democrats.
— In Scotland, Angus (down 64%), Stirling (down 63%) and Falkirk (down 62%).
A plurality of Labour’s lost votes here have most likely gone to the Scottish
National Party according to our data - either on an anti-Tory tactical vote, or
for other reasons. The remainder were likely driven in large measure by
unionist tactical voting, splitting more to the Conservatives than the Liberal
Democrats, as the Tories successfully positioned themselves as the leading
unionist party in many seats.
26
Where could tactical voting have made the most difference?
Datapraxis have identified 10 seats where systematic anti-Tory tactical voting could
have changed the outcomes, reducing the Conservative majority by 20. In six of
these seats - Kensington, Wimbledon, Carshalton & Wallington, Chipping Barnet,
South Cambridgeshire and Cheadle - it was very close indeed.
Constituency
Conservative %
Labour %
Liberal Democrat %
Wimbledon
38.4%
23.7%
37.2%
Kensington
38.3%
38.0%
21.3%
Cities of London and
39.9%
27.2%
30.7%
Westminster
Finchley and
43.8%
24.2%
31.9%
Golders Green
Carshalton and
42.4%
12.4%
41.1%
Wallington
Chipping Barnet
44.7%
42.6%
10.3%
South Cambridgeshire
46.3%
11.7%
42.0%
Watford
45.5%
37.9%
16.1%
Cheadle
46.0%
12.3%
41.8%
Truro and Falmouth
46.0%
38.3%
12.1%
Particularly in Kensington and Wimbledon, contradictory recommendations from
different tactical voting websites may have helped put the Tory candidate over the
top. The GetVoting website published by Best For Britain at the beginning of the
campaign was based on old polling data and recommended the Liberal Democrats
in far too many seats, including Putney, Truro & Falmouth, Camborne & Redruth
and Filton & Bradley Stoke. They later corrected this error and updated their model.
Remain tactical voting sites like the People’s Vote and Remain United ignored
constituency polling published in the Evening Standard and the final YouGov MRP
for Kensington to back ex-Conservative Liberal Democrat Sam Gyimah there. They
were operating on the hypothesis that Tory Remainers would be more likely to
switch to him, but he fell well short. Tactical.vote’s methodology of using primarily
2017 election results was accurate in many places, but wrong in Finchley & Golders
Green, Cities of London and Westminster, and Wimbledon.
27
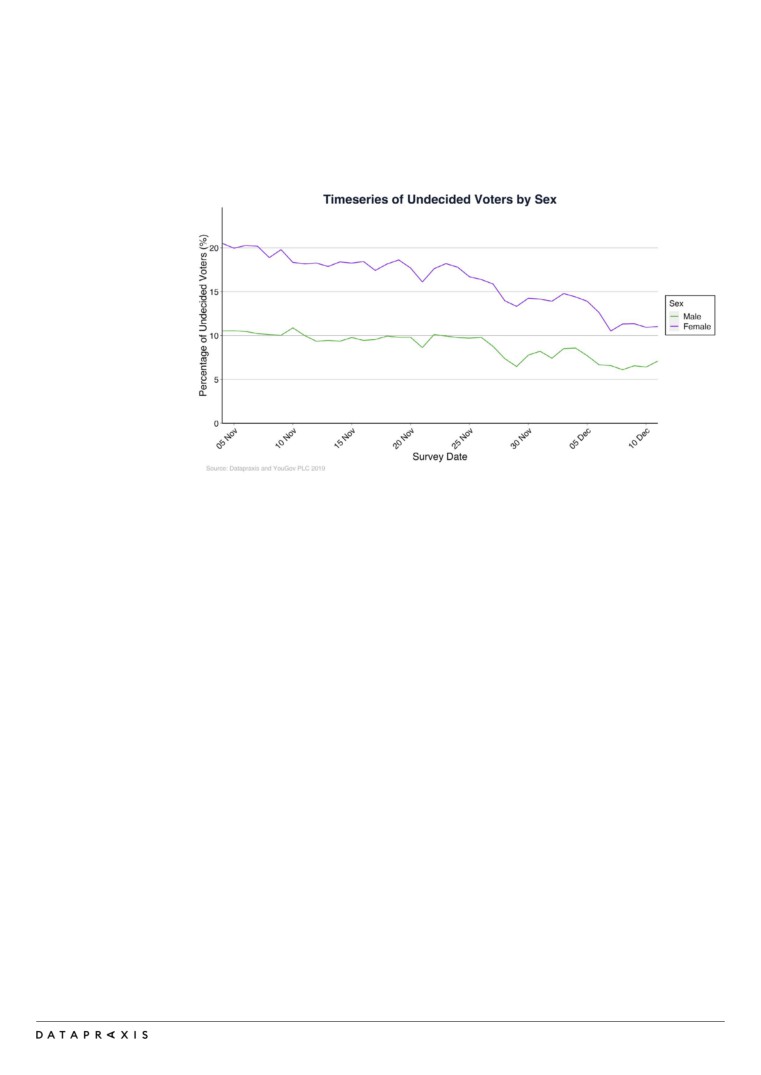
The Undecideds Election?
A remarkably high number of voters were undecided during the course of this
election, particularly women, although by 11th December the figure was similar to
that on 7 June 2017. This chart shows the trend lines and the difference between
men and women; almost twice as many female voters were undecided at the
beginning of the campaign.
People were undecided for many different reasons. But according to our research,
three major factors were as follows:
-
Many of them did not like either of the main candidates to be Prime Minister;
–
Many of them were cross-pressured by their Brexit opinion diverging from the
position of the party they usually vote for;
-
Many others were unsure either whether to vote tactically, or which party was
best placed to beat the party they liked least.
Turnout & voter registration
Over 3.2 million people registered to vote during the general election campaign,
two thirds of them under 35. This was a significant increase on the 2.3 million who
registered in the 2017 campaign, and a testament to the impressive work of non-
partisan registration campaigns like Vote For Your Future. Datapraxis modelled the
split of new registrations versus re-registrations, and the expected voting intention
of the newly registered voters, for every seat in which we were working with
clients. Many campaigns did not request or receive updated voter rolls after the
registration deadline.
28
The biggest increases in turnout between 2017 and 2019 took place in the following
seats (excluding Buckingham, where the former Speaker John Bercow stood down):
+7%Angus, Leeds North West, Putney, Cities of London &
Westminster, Battersea
+6% Kensington, North East Fife, Chelsea & Fulham
+5% Esher & Walton
The biggest drops in turnout (excluding Chorley, the seat of the new Speaker
Lindsay Hoyle) were as follows:
Stoke-On-Trent North
-19%
Wolverhampton South East, Luton South
-12%
Brentwood & Ongar, Kingston Upon Hull East & Hessle,
-11%
North Antrim, Slough
Across the Red Wall of formerly Labour heartland seats, overall turnout was
slightly down. Our best hypothesis is that some of the Labour Leave vote stayed
home in the end; almost half of the undecideds in this group found it very hard to
choose who to vote for, even when pressed with a squeeze question about a two
horse race toward the end of the campaign.
29
4
“Get Brexit Done” and other Campaign Messages
Datapraxis works with our campaign clients to analyse, develop and test
emotionally resonant messages. We tested hundreds of messages during the 2019
UK general election campaign or in the run-up. This gave us and our clients a
comprehensive map of the most important drivers of opinion and voting decisions
among different voter groups and tribes.
Dominic Cummings’s “Get Brexit Done” was an extraordinarily effective campaign
message for this election. While arguably not as game-changing as “Take Back
Control”, we found it resonating with a large majority of the public at large, and
with the overwhelming majority of all parts of the voter coalition the Tories needed
to assemble - even many Conservative and Labour Remainers. The British public
are simply sick of the Brexit tug-of-war, and want to move on to other pressing
issues. The irony is, of course, that Brexit is far from over and done with. We will
see whether this ends up damaging Johnson in the months and years to come.
The Conservatives’ attack lines were also highly effective. The “cost of Corbyn”
attacks (“The cost of Corbyn will hit you in the pocket”) cut through well, as did
the lines that “the country can’t afford the promises in Labour’s manifesto”,
and that “a hung Parliament just means more dither and delay”.
Labour had many lines in this campaign. Their initial headline message, “It’s Time
For Real Change”, tested brilliantly. It communicated the radicalism of the
manifesto positively, connected with the strong desires for change across all voter
tribes, and made clear the contrast with the Tories’ offer of “more of the same”.
However, it was used too infrequently and inconsistently in the campaign.
Headquarters started using “On Your Side” instead after they belatedly realised
the threat to the Labour Leave group; but this message was too inert to be an
effective counter to “Get Brexit Done”.
What proved much more successful for Labour was the counter-attack on the
NHS. Rather than bland familiar messages about Labour being “the party of the
NHS” or saving the NHS, the specific threat of US-style privatisation of the health
service from a post-Brexit Trump trade deal was communicated vividly and
relentlessly, through leaked documents, viral videos and a swarm of movement
communications.
The core values statement that “Our NHS is not for sale” was so powerful that
Boris Johnson started trying to reclaim it. But “Boris Johnson will sell our NHS
to Donald Trump” and similar messages gained very broad and rapid agreement,
as did “you can’t trust the Tories with the NHS” and “I’m worried my local
hospital can’t cope”.
This attack effectively disrupted the Brexit-Boris-NHS nexus of associations
created through the “We send £350 million a week to the EU, let’s spend it on
our NHS instead” message repeated relentlessly by Vote Leave in the 2016
30
referendum. We believe the NHS attack line was a major factor in Labour’s
resurgence of support among its 2017 Leave voters and other key groups. Our
private polling found the NHS rose in importance through the campaign, becoming
a bigger issue even than Brexit among undecided voters.
But it was all too little, too late. Negative messages about Jeremy Corbyn proved
overwhelmingly strong, in particular among Labour Leave and Conservative
Remain voters. Regardless of the origins of these negative perceptions, and
despite the party’s position strengthening through a strong campaign and massive
grassroots mobilisation, this was the fatal factor in the end for Labour’s prospects
in this election. While statements like “We need a new government to deliver real
change” had a slight edge over “We need to re-elect the current government to
get Brexit done”, more people were more worried about Jeremy Corbyn as prime
minister than about a Boris Johnson majority and a hard Tory Brexit.
The Liberal Democrat message that “Jo Swinson could be the next prime minister”
was one of the worst performing messages we have tested anywhere in Europe.
“Britain deserves better than Boris Johnson or Jeremy Corbyn” tested much
better; but a weak, shallow and hubristic Liberal Democrat campaign failed to get
anywhere near closing that deal with the social liberal and soft Conservative swing
voters they were targeting.
In the end, “best of a bad bunch I suppose” is the message which perhaps best
summarises the common sense of 44% of the British public. This is no ringing
endorsement. We see choppy waters ahead for Boris Johnson’s Conservatives.
We hope progressive parties and movements are ready to learn the lessons, to
ask themselves tough questions, and to work hard on message, strategy and
organisation in the coming months and years.
31
Background Notes
About us
Datapraxis provide strategic advice, public opinion research, modelling, analysis
and campaign services to political parties, non-profits, media and research institutes
across Europe. We worked with several campaigns in the 2019 General Election.
Paul Hilder is the founder and CEO of Datapraxis, and a leading authority on new
politics, big data and networked movements. He was previously co-founder of
Crowdpac, openDemocracy and 38 Degrees, and has played leadership roles at
Change.org, Avaaz, Oxfam, Purpose and the Young Foundation. He has twice been
a candidate to be General Secretary of the Labour Party.
Methodology
This report is based on analysis and modelling by Datapraxis as well as our
partners at YouGov. The underlying fieldwork source is almost 600,000 private
polling responses supplied by YouGov between 4th November and 11th December,
with typically 850-950 responses per constituency.
32