Lies, damn lies and …

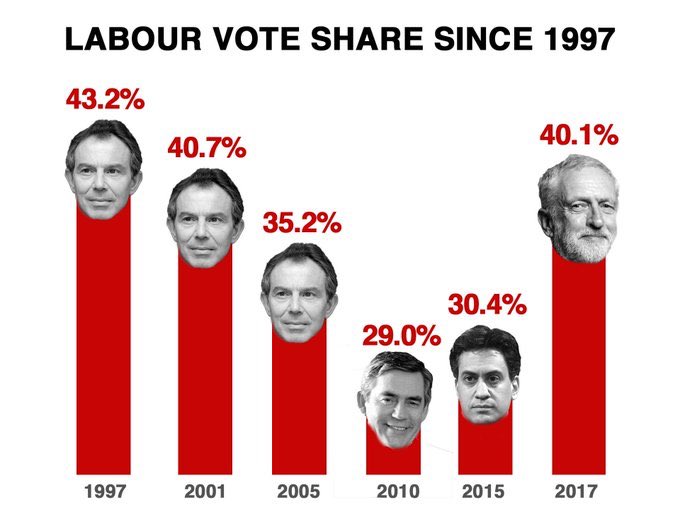
This time it’s about voter share but it reminds me of a debate I had about the quote in the title. We felt the and was actually an OR, Another piece of post election analysis that can’t wait. There is a chart being circulated showing Labour’s vote share with the startling result of 2017 as it’s last data point. This makes it pretty useless. They also commit the error of not publishing the complete vertical axis, which has the effect of exaggerating the visual differences and then it seems extend the charts using faces. Anyway, here’s my version …

We should remember that 1992 is 25 years ago, another generation. Without the 1992 data point the argument that 2017 is the anomaly in a declining labour vote is more compelling.

Here’s the meme I am critiquing.

 …

Nought, Nought

I was just writing a little piece involving some elementary charting and was reminded that my statistics teacher, Dr. Frank Oliver, will be turning in his grave. I looked him up and he sadly passed away and is seemingly not remembered for much, apart from winning an award for the nation’s most boring lecturer by presenting one on “Cofficiency Correlations”. One wonders if, in the days of  the rock star status of, Carol Vorderman and Rachal Riley, it would have attracted such attention; it seems to me to be part of the legitimisation of the idea that you can opt out of maths. My thoughts reminded me that bar charts & histograms must have 0,0 illustrated, their bars must be the same width and that line charts (or graphs as we called them) cannot be used interchangeably with bar charts. He will be remembered by some as an enthusiast for scientific economics, as a Labour County Councillor, and strangely for those that know or knew it, the Warden of Mardon Hall, allegedly the inspiration for Rowling’s Gryffndor House.  Google also reports his legacy as a benefactor to Exeter’s classical music world; it wasn’t an aspect of his life that I saw much of, possible because of a lack of interest. …

The Digital Divide in the UK

While researching another blog article, I was pointed at the ONS’ Statistical Bulletin, “Internet Access – Households and Individuals, 2011“. This reports that 77% (up from 73% last year) of UK Households have internet access, and 79% of internet users think they can protect their privacy. (Yeah right!)

They ask those who do not have the internet “Why not?” and the reasons are, price of equipment, lack of skills or lack of need. I’d be interested in those who find the cost of connection too high? …

Pivoting with medians and filtering frequency distributions in Excel

This was originally written as a note on how to build tables with complex values i.e. values other than those supported in pivot tables.It focused on using range names and countif[s]/sumif[s]. One of the side effects was to document the use of range arrays and functional filtering. i.e. specifying an array within a cell and filtering the values down to one. This later piece of functionality has caused me to return to this page more frequently than the table construction. I have amended the tags and inserted this paragraph as finding it proved harder than I wanted.  …