And today, Sunak announces a new policy, a pension triple lock plus. This is effectively guaranteeing that a triple lock pension will become and remain tax free. It is however closing the stable door after the horse has been chased away.
Sunak as chancellor froze the tax free allowance in 2021 which is what is leading to the risk that state pension income will be taxed. and they also skipped the wages linked increase in 2021 and they were talking about missing the inflation linking in the year of the energy price increases. Hunt also suggested the abolition of NI payments, which would mean that link between contribution and entitlement would be lost. Another indicator of the value of Government promises on pensions is the now deemed illegal reduction in entitlements for their employees i.e. for Civil Servants whose pensions they have been raiding for years.
Sunak has proposed that Maths should be taught to 18. I think this ambition i.e. of better equipping people to understand data and draw conclusions needs redesign earlier in the curriculum and would be informed by a study in the UK’s failure to adopt the Baccalaureate. Some say that they’ll need more [and better paid] teachers, which they seem unwilling to fund. I think this is just revisiting failed reforms of the last half century. I seem to remember some nonsense in the 70’s about scientists in the Civil Service, and after a bit of looking around came upon this review of the Fulton Report; it made little difference.
A common question has been how much have I used my A level and 1st year graduate statistics education. The answer is a bit. Linear & Quadratic correlation has been useful a couple of times, queuing theory at least once, and I had to mug up some hypothesis testing for that one project I did using 6 sigma. More than most maybe. Although at least once, my then manager’s own poor statistical education led to him putting it in the bin, because he didn’t have the confidence to sell the results.
When doing the 6-sigma project I discovered that many of the distribution tables needed to perform the statistical tests were encapsulated in costly software. I amused myself by bringing in my uni. text book, which had the distributions printed but which was older than many of my colleagues. They had remained useful, the tables that is, and I still have the book on my book shelf.
For my foreign audience, in the UK, students from 16-18 study 3-5 subjects often reducing their subjects studied at the end of the 1st year. There isn’t really room to push Maths into that time table if a student has made otherwise sensible contiguous choices. This is supported imposed by the Universities who claim that early specialisation leads to our graduates being better qualified at the end of the first degree. I suspect that most US university academics would disagree, For my British readers, the early specialisation, at 16, is unusual, with other countries using other curriculum design techniques to provide a broad 16-18 education. Also the fact of a Prime Minster in the 21st Century educated at University in Greek and Latin must have been a source of amusement to the French graduates of the Ecole National d’Administration, an amusement enlarged by calling it Greats!
All this on the day when Starmer flags his second thoughts on Labour’s promise of abolishing student tuition fees. …
I wrote a short piece on the potential need for the EU to acquire direct taxation powers which led to me checking how much the UK government raised from income based taxes vs. VAT. The article reproduced some charts from Parliament but I was surprised to discover how low a share of government revenue it now represented. The article was written after the budget, which had not really made an impact in my consciousness; it just seemed ‘meh’ to me. It is however yet another turning of the screw in a largely successful attempt to make the working classes pay for the crisis in national income and wealth facing this country.
[He can ] deliver a spring statement – AKA a seismic budget in any other year – that offers nothing to the poorest and most vulnerable members of society while sobbing on their behalf. Who can tell the chamber with a straight face that he is committed to cutting taxes even when the Office of Budget Responsibility is saying that the tax burden is set to go up to 36.3% by 2026: the highest level since the 1940s.
Critics of UK chancellor’s spring statement say it prioritises debt reduction and fails to provide support to lower-income households
Philip Inman
This despite the sub-headline concentrates on the macro-economics, reflecting the argument that since the Govt has borrowed on variable interest rate bonds, as inflation kicks in, they argue they need more money to service the debt. The article concludes by observing that inflation may fall, that soaring energy costs are a drag on prosperity, and that the real reason for increasing tax revenues is to be able to give it back in the run-up to an election.
Despite being under pressure to minimise the effects of the cost of living crisis, driven by Brexit and energy cost inflation and help households across the country who are being forced into poverty, all the budget did was announce a cut on fuel duty, Labour are asking for a VAT cut on energy bills, although instructing Ofgem to implement a price cap would be more effective. He also raised the threshold at which people start to pay National Insurance, which is a means of alleviating the fiscal drag created by freezing the tax free allowance.
From Inman’s article, I also note that Sunak has frozen the income tax free relief for the next four years, together with the IHT limits. The effect of this is that before, people could expect the tax free allowance to rise in accordance with inflation, giving them small amounts of extra disposable income, even if they did not get a pay rise. This has now gone. It will also have the effect of raising the share of income tax paid by the low paid.
He also, in contradiction, to the Tories election promise suspended the pension link with earnings for 2022/23 although he claims to be willing to reintroduce it next year. He has also cut the amount the poorest in our society get by clawing back the uplift paid in 2019-2021.
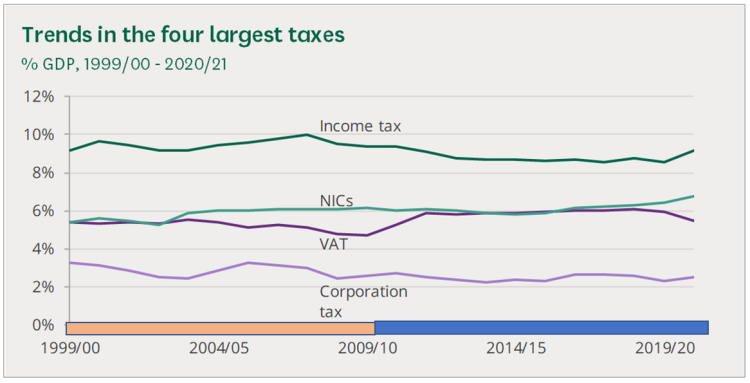
My segue into this piece was the low proportion of government income attributed to Income Tax vs VAT. The House of Commons Library produced a report called, Tax Statistics: an overview, and my previous article reproduces some charts from it while making the point that treating NI as separate category minimises the impact of employee contributions, which are levied at 12% until one begins to pay higher rate tax and allows Income Tax to be described as more progressive than it is. NIC’s also are paid by employer’s and so clarity on corporate contribution to the exchequer is also reduced.
from the HoC Library Report : Open Parliament Licence v3.0.
VAT is 20%, for the less well paid more than they pay from Income Tax. This needs to be rebalanced.
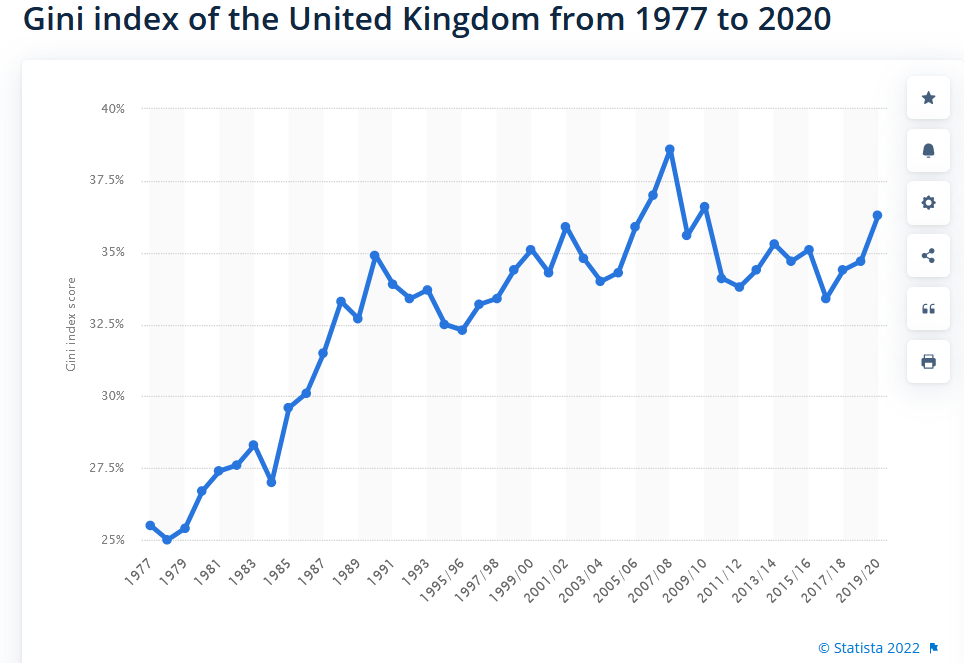
I finish with Statista’s charting of the Gini Coefficient over time., which measures the level of income inequality in our society,
Statista UK Gini Coefficient over time , used under Statista Terms of Use
We have the lowest social security net in Europe, the lowest pensions and amongst the most strongly regulated Unions. Something’s got to give. …
This website uses cookies to improve your experience. We'll assume you're ok with this, but you can opt-out if you wish.AcceptRead More
Privacy & Cookies Policy
Privacy Overview
This website uses cookies to improve your experience while you navigate through the website. Out of these, the cookies that are categorized as necessary are stored on your browser as they are essential for the working of basic functionalities of the website. We also use third-party cookies that help us analyze and understand how you use this website. These cookies will be stored in your browser only with your consent. You also have the option to opt-out of these cookies. But opting out of some of these cookies may affect your browsing experience.
Necessary cookies are absolutely essential for the website to function properly. This category only includes cookies that ensures basic functionalities and security features of the website. These cookies do not store any personal information.
Any cookies that may not be particularly necessary for the website to function and is used specifically to collect user personal data via analytics, ads, other embedded contents are termed as non-necessary cookies. It is mandatory to procure user consent prior to running these cookies on your website.