I wrote a short piece on the potential need for the EU to acquire direct taxation powers which led to me checking how much the UK government raised from income based taxes vs. VAT. The article reproduced some charts from Parliament but I was surprised to discover how low a share of government revenue it now represented. The article was written after the budget, which had not really made an impact in my consciousness; it just seemed ‘meh’ to me. It is however yet another turning of the screw in a largely successful attempt to make the working classes pay for the crisis in national income and wealth facing this country.
John Crace reviews the speech and budget in this article on the Guardian, A mini budget full of lies from Rishi Sunak, the people’s millionaire , and says,
[He can ] deliver a spring statement – AKA a seismic budget in any other year – that offers nothing to the poorest and most vulnerable members of society while sobbing on their behalf. Who can tell the chamber with a straight face that he is committed to cutting taxes even when the Office of Budget Responsibility is saying that the tax burden is set to go up to 36.3% by 2026: the highest level since the 1940s.
John Crace
I recommend you read Crace’s article in full.
It also reports on the budget, in an article by Philip Inman, their economics editor, Rishi Sunak ‘protecting Treasury from inflation at families’ expense’ | Spring statement 2022
Critics of UK chancellor’s spring statement say it prioritises debt reduction and fails to provide support to lower-income households
Philip Inman
This despite the sub-headline concentrates on the macro-economics, reflecting the argument that since the Govt has borrowed on variable interest rate bonds, as inflation kicks in, they argue they need more money to service the debt. The article concludes by observing that inflation may fall, that soaring energy costs are a drag on prosperity, and that the real reason for increasing tax revenues is to be able to give it back in the run-up to an election.
Despite being under pressure to minimise the effects of the cost of living crisis, driven by Brexit and energy cost inflation and help households across the country who are being forced into poverty, all the budget did was announce a cut on fuel duty, Labour are asking for a VAT cut on energy bills, although instructing Ofgem to implement a price cap would be more effective. He also raised the threshold at which people start to pay National Insurance, which is a means of alleviating the fiscal drag created by freezing the tax free allowance.
From Inman’s article, I also note that Sunak has frozen the income tax free relief for the next four years, together with the IHT limits. The effect of this is that before, people could expect the tax free allowance to rise in accordance with inflation, giving them small amounts of extra disposable income, even if they did not get a pay rise. This has now gone. It will also have the effect of raising the share of income tax paid by the low paid.
He also, in contradiction, to the Tories election promise suspended the pension link with earnings for 2022/23 although he claims to be willing to reintroduce it next year. He has also cut the amount the poorest in our society get by clawing back the uplift paid in 2019-2021.
My segue into this piece was the low proportion of government income attributed to Income Tax vs VAT. The House of Commons Library produced a report called, Tax Statistics: an overview, and my previous article reproduces some charts from it while making the point that treating NI as separate category minimises the impact of employee contributions, which are levied at 12% until one begins to pay higher rate tax and allows Income Tax to be described as more progressive than it is. NIC’s also are paid by employer’s and so clarity on corporate contribution to the exchequer is also reduced.
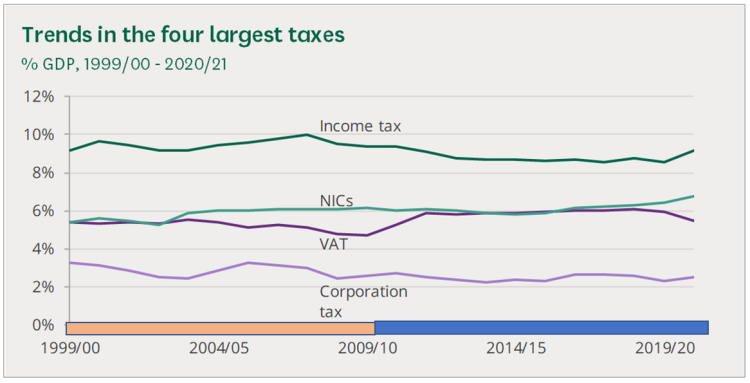
VAT is 20%, for the less well paid more than they pay from Income Tax. This needs to be rebalanced.
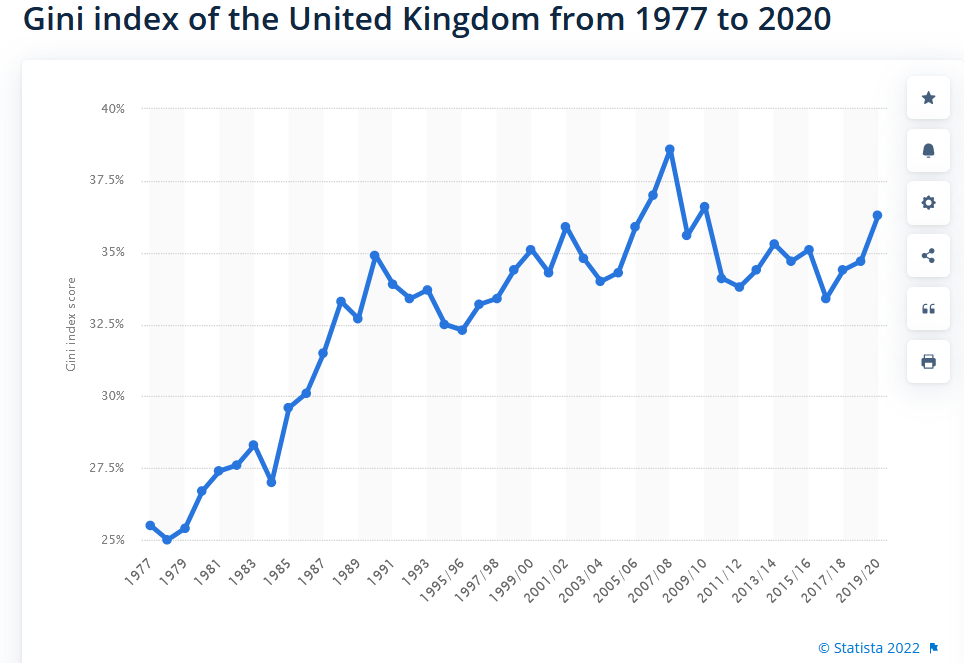
I finish with Statista’s charting of the Gini Coefficient over time., which measures the level of income inequality in our society,
We have the lowest social security net in Europe, the lowest pensions and amongst the most strongly regulated Unions. Something’s got to give.