Labour’s Samantha Latouche has won the New Cross by-election and won it well. Congratulations, now let’s look at the numbers.
Here’s a table showing the top vote for each party in 2018, when the council last had a general election. I have used the top vote of each party (of those that stood). This may cause some inconsistencies as in 2018 people might have voted both for the one green candidate and the top Labour candidate but this is the best I can do. My data source is Lewisham Council’s site. The 2021 by-election results.

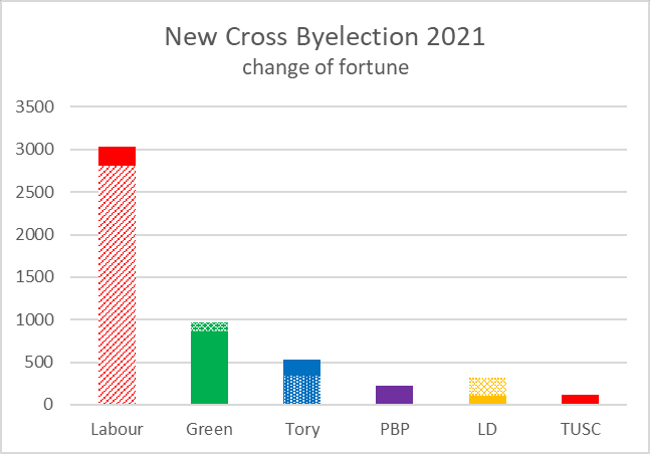
I experiments with several chart types and came up with this. The solid bars represent the current vote, so if above the hatched bars, this shows a gain, and if below it represents a fall in voter share. The turnout was better than in 2018, wonder why that was and we should note that the Tory vote increased, while the Green vote decreased.
Pingback:Is voter id/GOTV worthwhile? |