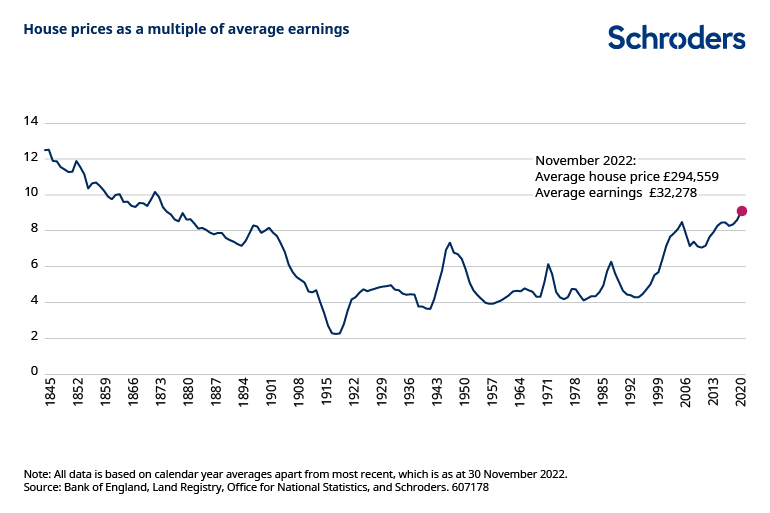
I came across the video from the i linked to below and wondered how much the assertion that the UK has never had such a malign nexus, oh high inflation, high interest rates and high consumer debt. I was shocked at the Schroders report that the price to income ratio is now nine i.e. a house costs nine times the purchaser’s income.
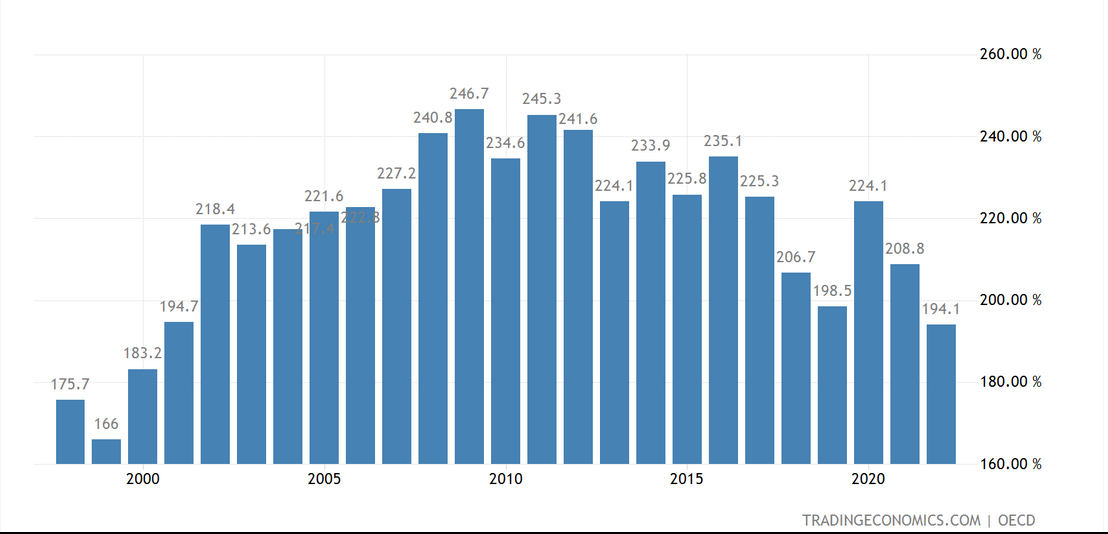
The price to income ratio is the nominal house price index divided by the nominal disposable income per head and can be considered as a measure of affordability.
OECD
I found a press release from Schroeders on affordability, which is where I found a detailed description of the affordability ratio’s history.
PWC on gross consumer debt topping 2Tn GBP
Total household debt in the UK now exceeds £2 trillion for the very first time – the equivalent to £71,000 per household, and is just below national GDP (£2.2 trillion).
PWC Press Release 27 Mar 2023
Maybe this needs a look at private vs public debt and in the context of the GDP. If house prices fall, collateral value falls, the capacity to borrow is constrained and then if the Govt. reduces its borrowing, then there is a double -ive reduction in demand. Austerity is doubly bonkers. However Trading economics figures are quite odd, suggetsing that private debt is the lowest its been for 23 years.