In order to answer the questions I want answered I need the election results in spreadsheet form. I have previously got this from the Electoral Commission; it took ’em 18 days to get it out last time, wonder what the delay is this time. Eventually, I was pointed at the House of Commons Library Page, and have posted the results by constituency .xlsx file to this site (it became available on the 28th Jan). I originally made some notes about retrieving the results from the Democracy Club. Here are my notes. …
Raw Facts
However the Democracy Club claims to have them available via a REST or REST like service.
Reality requires a deeper look; it also requires the recognition that some of those seats will have been lost because remain supporting labour voters chose to vote elsewhere. Would the result have been better or worse if we had not promised the second referendum? How many of these seats did we lose by less than the Green/LibDem vote? How many of the seats in the Leave voting majorities that we held, might we have lost if remain supporters had been less committed to us? It could have been worse! For a more detailed insight I need to wait for the Electoral Commission spreadsheet.
Links
- HoC Library General Election 2019: full results and analysis, actually a copy
It’s important to know the referendum results
- Final estimates of the Leave vote, or ‘Area interpolation and the UK’s referendum on EU membership’, by Chris Hanretty, in which he posts three spreadsheets detailing the referendum results by CLP.
- Mapping the Brexit vote by Chris Green, about Maps and results
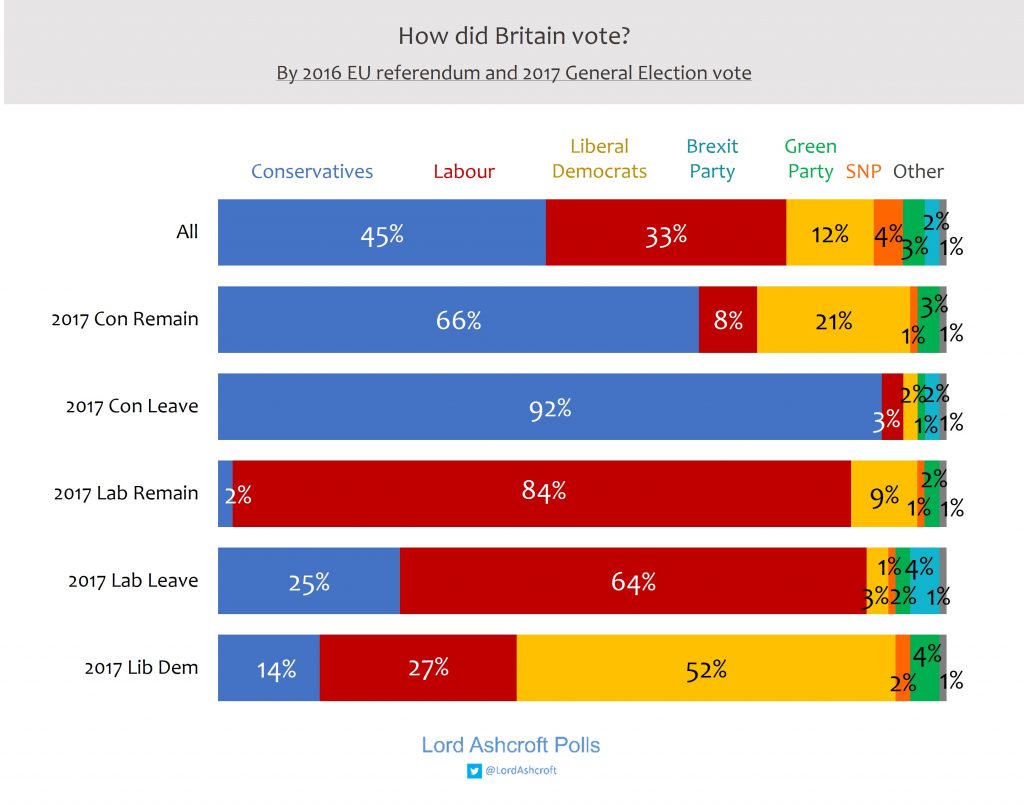
- Lord Ashcroft also published some data on Leave/Remain, I need to estimate the % Tory remain vote.
Here’s the democracy club resources, which I couldn’t get to work.
- Democracy Club … endpoints
- Democracy Club, Candidate CSV downloads, points to …
- Democracy Club, results, a how to
- Here’s the election centre’s download page, (still not yet uploaded) – 9 Jan 2020
I was pointed at two other sources,
- https://www.britishelectionstudy.com/get-started/
- https://yougov.co.uk/topics/politics/articles-reports/2019/12/17/how-britain-voted-2019-general-election
- How Britain voted and why: My 2019 general election post-vote poll bt Michael Ashcroft, includes a chart of when people made up their mind and a Leave Remain by Party.
- Ashcroft did a refresher on the Referendum.
- The 2019 general election and the geography and demography of Brexit, by Danny Dorling at his site.
I made a spreadsheet in excel, detailing the estimates of the Remain/Leave split. I have not documented the exact source, or the transformation, but it is not an original piece of work.
Demographics by others (Spring 2021)
There is much talk of the Red Wall and how to win it back, unfortunately everyone is focussed on the man who used to “keep whippets in the [outdoor] latrine”, this article by Danny Dorling, précised in his blog, and reinforced by this article in the Economist suggest the problem is elsewhere, that it’s not the towns but their suburbs and the growing inequality in our society. There is plenty of evidence that age is also a factor.
Hindsight is 20/20
People just won’t go away, I need to collect some comments, and ideally charts that show that Labour didn’t loose the working class, they lost Thatcher’s children, i.e. their parents.
- It’s a myth that Labour has lost the working class by Ash Sarker, arguing that the A-E proxy of class is not relevant any more
- Labour’s lost heartlands. Can it win them back? [FT £|Θ] Stories and nonsense, but a forecast for the Hartlepool by-election.
- Has Labour really lost the working class? from Open Democracy. this has lots of charts, but not very accessible i.e. not so easy to understand
ooOOOoo
The image came from webrootsdemocracy.org, it has been cropped and resized I have not made it available, and stored and processed it for my usual reasons, addressability, longevity and performance.
election results by constituency, xls link at bottom:
https://researchbriefings.parliament.uk/ResearchBriefing/Summary/CBP-8749
Thanks
Updated today, added the Hanretty and Green links
I added the comments about Demography and the links to more of Dorling’s articles together with the Economist link.
I have added the Ashcroft links. I think I need to build a GE19 & Ref visualisation in order to see if there is an easy way to make assumptions about how the Tories voted in the Referendum; we can assume that none of them switched to Labour in 19. I find it hard to believe that 31% of Tories voted Remain across the whole country, surely it’ll be skewed but based on what. Actually why not run the model at 31% everywhere, see what it says.