I attended a Campaign Lab Hack Day and decided to look at the political donations projects. I then downloaded the Electoral Commission stats on donations for what looks like Q4 2023 and done some quick charts, I’ll put my spreadsheet up once I tidy it up. The Tories have collected a shed load of money, rich donors have failed to show up for Labour. Short money remains very important to the opposition parties. This was originally published on the assumption I had all the figures for the year. See over/below for the two charts now found to be incorrectly titled as the data is for the last quarter 23 only …
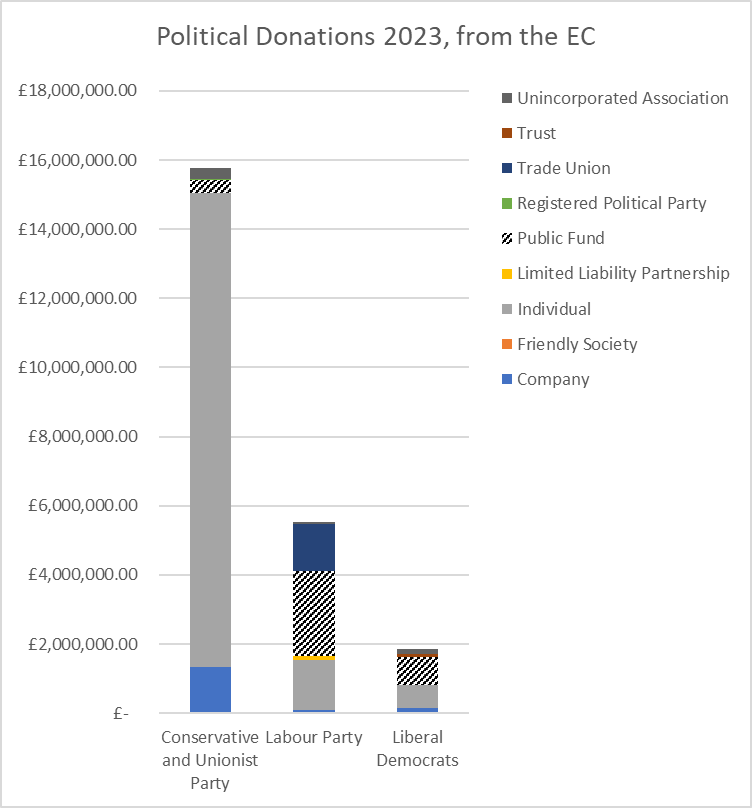
I have two charts comparing the three biggest recipients.
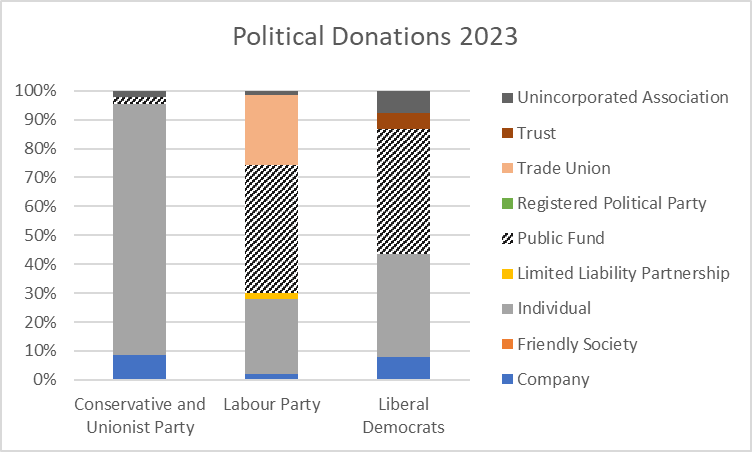
The EC defines nine potential classes of source, the next chart shows the proportion each source donates to the top three parties.
The Tories are far ahead of all the other parties. This money is coming from individuals. More detail is illustrated at “Who funds the Conservatives?” Labour receives a lot of money from membership fees and small donations so their total revenue will be higher than described here but they would seem highly dependent on the “short money”.
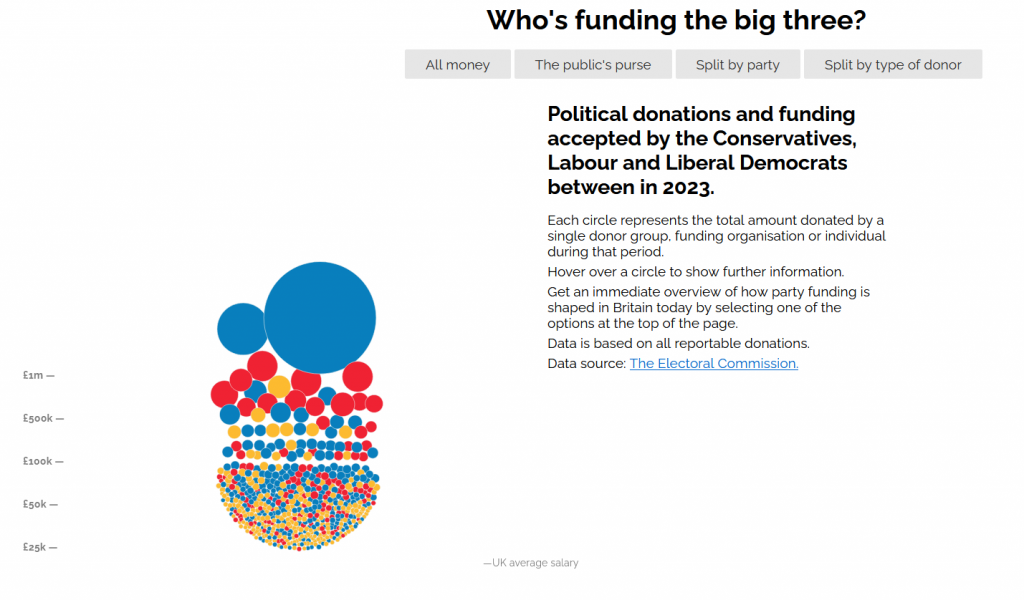
Another view
I attended a campaign lab hack day yesterday, and found an alternative web site which displays the data for 2013; I have inserted my data file into Neil’s code and it can be viewed here. Maybe I need to look at the javascript code (& maybe the css).
The independent reports some different numbers. I wonder why,
It looks like I did Q4 only.