I wanted to say something simple about the cost of desk space in London and made it complicated. I made a map showing relative costs, this is how.
Desk Rental
First get some data, here’s realla with 2019 data from which I have made a spreadsheet and chart.
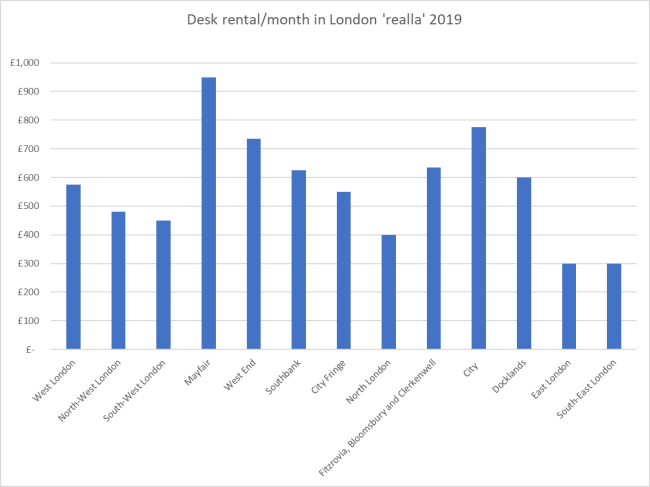
I think these costs are ground rent only, inc. of basic utilities but not including IT or Telco costs. (Let’s say £35 p.m. for the telco and £50 pm for the laptop, but these are not included in the charts).
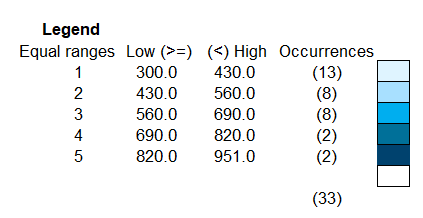
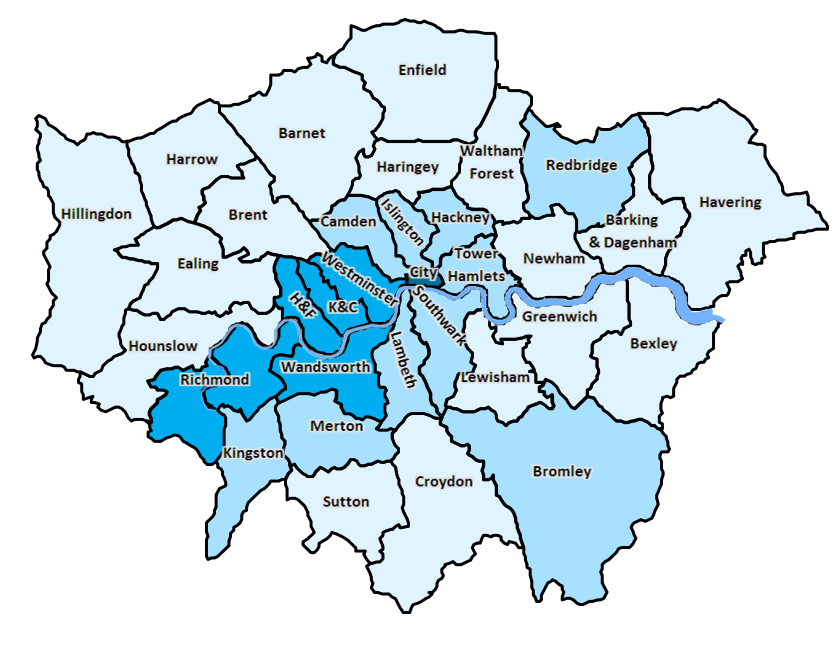
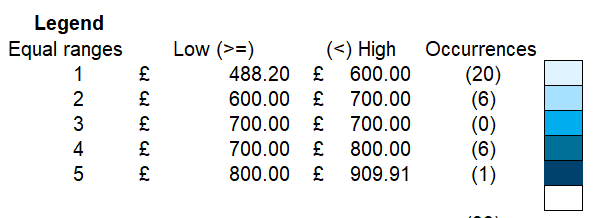
Then the Mayor & GLA have made a mapping display tool, this is available here. I have transcribed my data to a sheet using this as a template. It has the instructions within the sheet and I have produced this map.

It doesn’t really tell you anything that’s not obvious, except perhaps that Southbank is more expensive than you’d think.
Income
And while I was at it, I made one about income,
Living Rent
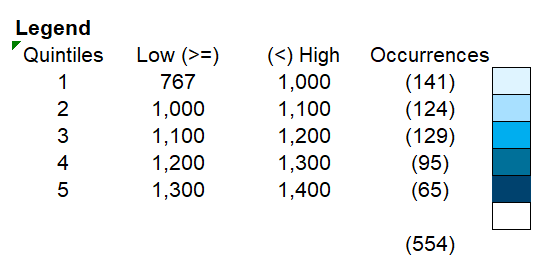
I went from income to the London Living Rent and I made one showing the London Living Rent by ward!
The GLA Template is here. The GLA’s data is here. I am using the figure for a three bedroom property.
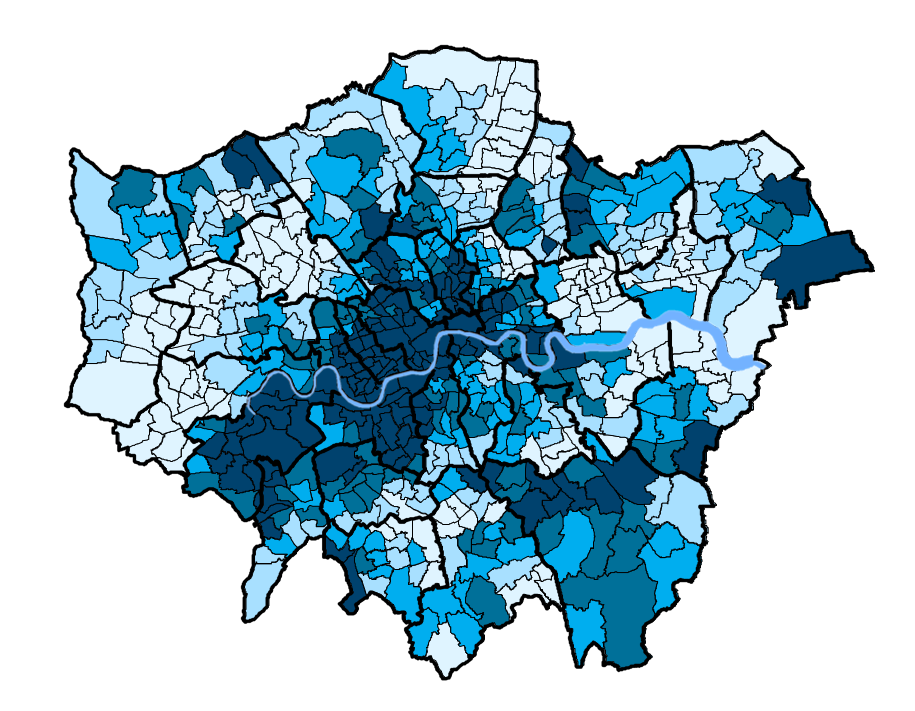
And I have enlarged Lewisham,

Let’s remember that the LLR is as much a proxy for income as it is for land value, which is itself driven by the effective demand for housing.
Green Party Vote
I did one for the London Green Vote. With the modern versions of excel, i needed to make the folder a ‘trusted location’.
It seems I dreamed of some of this when looking at TripTrop.